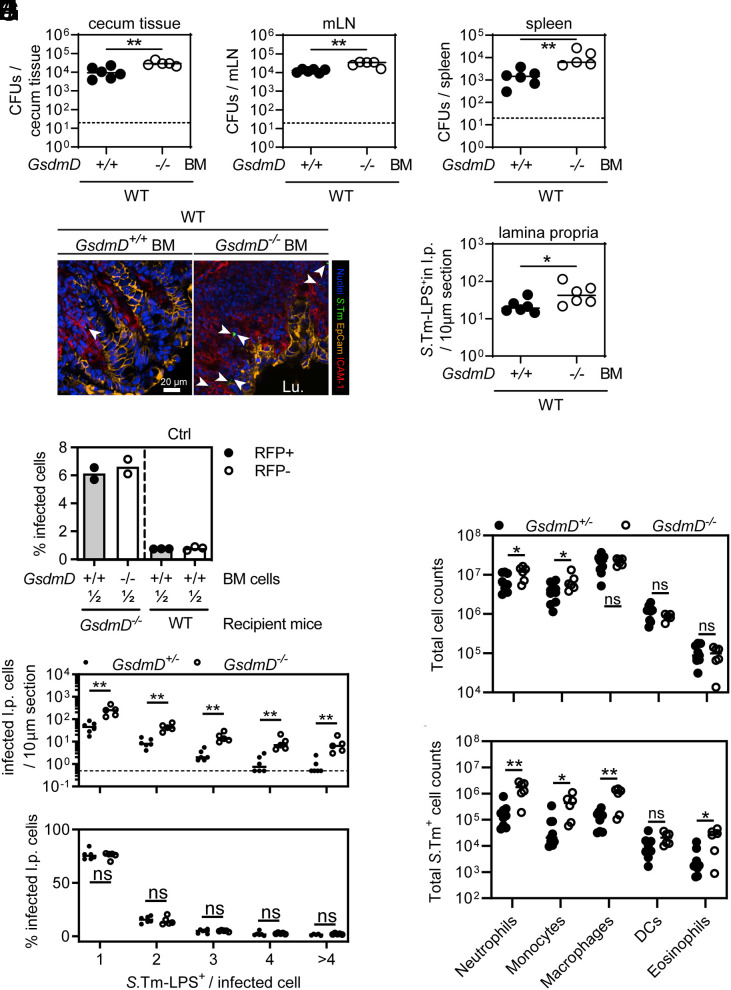
Fig. 3.
Bone-marrow-derived cells employ GSDMD to restrict S.Tm tissue loads. (A–E) Transfer of GsdmD−/− bone marrow (BM) cells results in elevated S.Tm pathogen loads locally and systemically at 72 h p.i. S.Tm pathogen loads in (A) cecum tissue, (B) mesenteric lymph nodes, and (C) spleen. (D) Representative micrographs of cecum tissue sections, stained for S.Tm-LPS. Arrowheads indicate S.Tm in the lamina propria. Lu.–lumen. (E) Microscopy-based quantification of S.Tm-LPS+ cells in the lamina propria. (F) S.Tm infection of mixed BM chimeras with a 1:1 ratio of either RFP-expressing GSDMD-proficient cells and RFP-non-expressing GSDMD-deficient cells or WT RFP-expressing and non-expressing cells as a control. Percentage of S.Tm-LPS+ cells determined by flow cytometry. (G and H) GSDMD deficiency leads to a general increase of infected lamina propria cells. Fluorescence microscopy–based quantification of S.Tm-LPS+ lamina propria cells at 72 h p.i. (G) Microscopy-based quantification of S.Tm-LPS+ cells in the lamina propria grouped by the number of S.Tm-LPS+ per cell. (H) Relative percentage of the quantification in G. (I and J) Lamina propria cells more frequently harbor S.Tm in GSDMD-deficient mice. Flow cytometry analysis of lamina propria cells from 72 h infected GsdmD+/− and GsdmD−/− littermates. (I) Total cell population sizes in the lamina propria. (J) Total S.Tm-LPS+ cell numbers in the lamina propria. In A–C and E–J, each data point represents one mouse. Data are combined from ≥2 independent experiments for each comparison except for F, where only one representative experiment is shown out of 2. Line at median. The dotted line represents the detection limit. Mann-Whitney U test (ns–not significant, *P < 0.05, **P < 0.01).

