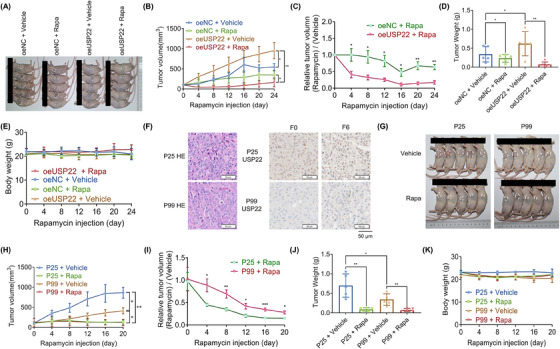
FIGURE 4.

USP22 promotes tumor growth and sensitivity to rapamycin in vivo. (A) The tumor images of each group (n = 5). (B) Tumor volumes measured and compared every 4 days in each group. (C) The calculated relative tumor volume (Rapa/vehicle). Compared to the oeNC group, significant tumor regression was observed in the oeUSP22 group (p < 0.01). (D) Tumor weights of each group. (E) Mouse body weights of each group. There are no significant differences noted. (F) Hematoxylin–eosin staining and USP22 expression in two patient‐derived tumor xenograft models in the F0 and F6 generations. (G) Tumor images of each group (n = 5). (H) Tumor volumes of each group. (I) Comparison of the relative tumor volume (Rapa/vehicle). (J) Tumor weights of each group. (K) Mouse body weights of each group, there are no significant differences noted (* p < 0.05, ** p < 0.01, *** p < 0.001).
