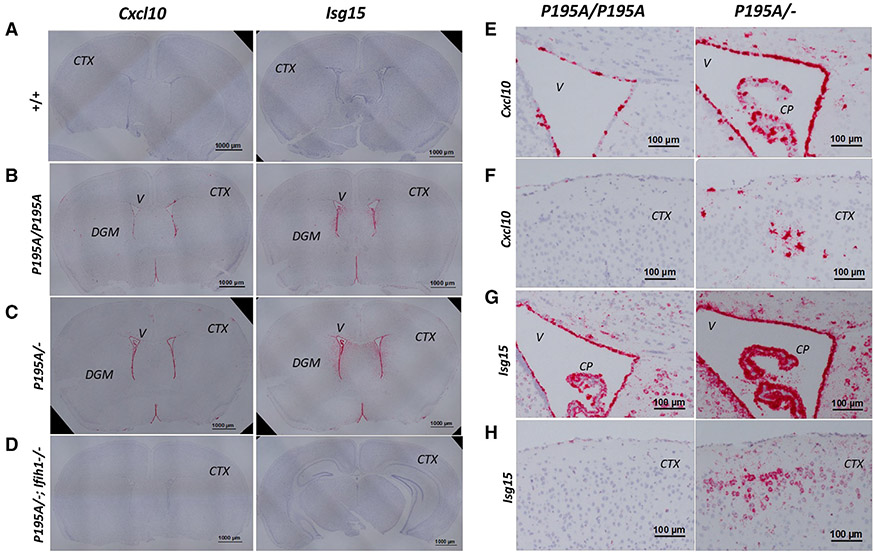
Figure 3. Distribution of ISG expression in AdarP195A/P195A and AdarP195A/− mouse brains determined by RNA ISH.
(A–D) Interferon-stimulated gene (ISG) expression in mouse brains was detected using RNA ISH on formalin-fixed paraffin-embedded sections of 8-week-old Adar+/+, AdarP195A/P195A, AdarP195A/−, and AdarP195A/−; Ifih1−/− mice. Shown are brain coronal sections stained with Cxcl10 or Isg15 probes. Both probes show ISG expression in the periventricular areas and on cell clusters scattered in the cortex and DGM areas of AdarP195A/P195A (B) and AdarP195A/− mice (C), while no staining was observed in Adar+/+ (A) and AdarP195A/−; Ifih1−/− triple-mutant mice (D). V, ventricle; CTX, cortex. Scale bar, 1,000 μm in (A)–(D).
(E) ISG expression in the periventricular areas detected with the CXCL10 probe in AdarP195A/P195A and AdarP195A/− mice. Ependymocytes and choroid plexus epithelial cells were highly stained on sections of AdarP195A/P195A and AdarP195A/− mice. Staining in AdarP195A/P195A mice was mainly on the ependymocytes, and more intense staining was observed in AdarP195A/− mice, including the adjacent cells in periventricular areas. V, ventricle; CP, choroid plexus. Scale bar, 100 μm.
(F) ISG expression in the brain surface cortical areas detected with the Cxcl10 probe in AdarP195A/P195A and AdarP195A/− mice. Scattered focuses were stained with the typical morphology of microglial cells in AdarP195A/− mice. Much fewer cells were stained in the AdarP195A/P195A mice. CTX, cortex. Scale bar, 100 μm.
(G) ISG expression detected with ISG-15 probe in the periventricular areas on brain sections of AdarP195A/P195A and AdarP195A/− mice. The staining pattern of the ISG-15 probe on ependymocytes and choroid plexus epithelial cells was similar to that of the CXCL-10 probe. The ISG-15 probe also stained cells in the periventricular areas showing neuron morphologic features. Staining in AAdarP195A/− mice was more intense than in AdarP195A/− mice. V, ventricle; CP, choroid plexus. Scale bar, 100 μm.
(H) ISG expression detected with Isg15 probe in the brain surface cortical areas on brain sections of AdarP195A/P195A and AdarP195A/− mice. Scattered areas with cells showing typical morphology of neurons were stained in AdarP195A/− mice, whereas much less staining was observed in AdarP195A/P195A mice. CTX, cortex. Scale bar, 100 μm.

