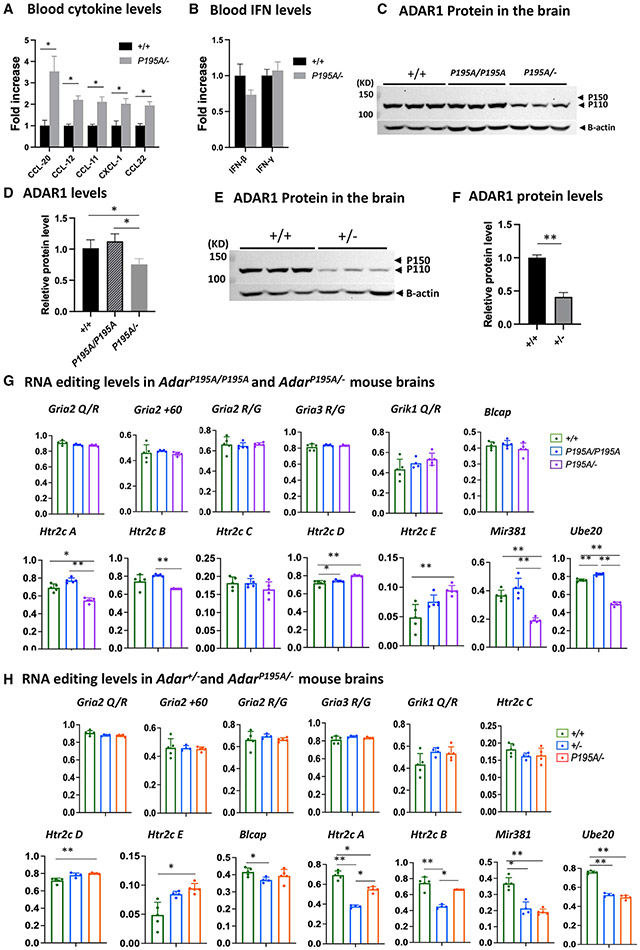
Figure 4. Decreased ADAR1 protein and RNA-editing levels in AdarP195A/− and Adar+/− mice.
(A) Luminex assay was used to measure the blood cytokine/chemokine levels of AdarP195A/− mice. Among the tested cytokines of the available panels, levels of CCL-20, CCL12, CCL-11, CXCL-1, and CCL22 were significantly increased in AdarP195A/− mice in comparison to the WT mice. n = 5 for both control and AdarP195A/− groups. The nonparametric Wilcoxon rank-sum test was used to test the differences between the two groups. *p < 0.05. The complete panel is listed in Table S1.
(B) IFN-β and IFN-γ levels in the blood were assessed in the Luminex panels. n = 5 for both control and AdarP195A/− groups. Their levels were not different between AdarP195A/− and WT mice.
(C) Brain ADAR1 protein levels in AdarP195A/P195A and AdarP195A/− mice were analyzed by western blotting and compared with WT mice. ADAR1 p110 isoform was abundantly expressed in the brains of the WT and AdarP195A/P195A mice, while no obvious expression of ADAR1 p150 isoform was observed. ADAR1 protein in AdarP195A/P195A mice was not significantly different from that in WT mice. However, much less ADAR1 protein was observed in AdarP195A/− mouse brains.
(D) Quantification of ADAR1 protein shown in (C). There is no significant difference between WT and AdarP195A/P195A mice, while the ADAR1 protein level in AdarP195A/− mice is significantly lower than in WT and AdarP195A/P195A mice. n = 3, *p < 0.05 (nonparametric Wilcoxon rank-sum test).
(E) To determine whether a single copy of WT Adar allele also causes ADAR1 protein level decrease, ADAR1 in Adar+/− mice was assessed and compared with WT mice. Significantly less ADAR1 was observed in Adar+/− mice.
(F) ADAR1 protein levels in Adar+/− and Adar+/+ mice were quantified and compared. The ADAR1 protein level in Adar+/− mice was significantly less than that in Adar+/+ mice. n = 3, *p < 0.05 (nonparametric Wilcoxon rank-sum test).
(G) Brain RNAs were isolated from AdarP195A/P195A and AdarP195A/− mouse brains, and A-to-I RNA-editing levels were assessed via Sanger sequencing analysis. RNA editing at the known editing sites in defined neural RNA-editing substrates, including editing sites in the Gira2, Rria3, Grik1, and Htr2c neuron receptor, as well as the editing sites in mRNAs for Blcap, Ube2o, and the miR381, were compared with the WT control mice and between AdarP195A/P195A and AdarP195A/− mice. At all tested sites, RNA-editing levels in AdarP195A/P195A mice were the same or even higher than the WT control mice, while, in AdarP195A/− mice, only editing in miR381 and Ube2o mRNAs was significantly lower than that in AdarP195A/P195A and WT control mice.
(H) RNA-editing activities in the brain of Adar+/− and AdarP195A/− mice were assessed by Sanger sequencing analysis to determine whether the P195A mutation affects the RNA-editing activity of ADAR1 at a low protein dose. As shown in (G), the RNA-editing levels at the defined editing sites were assessed and compared with the WT control mice. Except for Htr2c A and B sites and in miR381 and Ube2o mRNA, RNA-editing levels in Adar+/− and AdarP195A/− mice were the same or even higher than those in the WT control mice. RNA-editing levels at Htr2c A and B sites and in miR381 and Ube2o mRNA were significantly lower in Adar+/− and AdarP195A/− mice. However, editing levels in Htr2c and Ube20 mRNAs in AdarP195A/− mice were not different from those in Adar+/− mice and were even higher than those in Adar+/− mice at the Htr2c A and B sites. In (G) and (H), the average editing levels and SDs are shown. n = 5 (WT) and n = 6 (AdarP195A/P195A and AdarP195A/P195A/Ifih1−/−). The nonparametric Wilcoxon rank-sum test was used to test the differences between the two groups. The significant differences are indicated. *p < 0.05, **p < 0.01.

