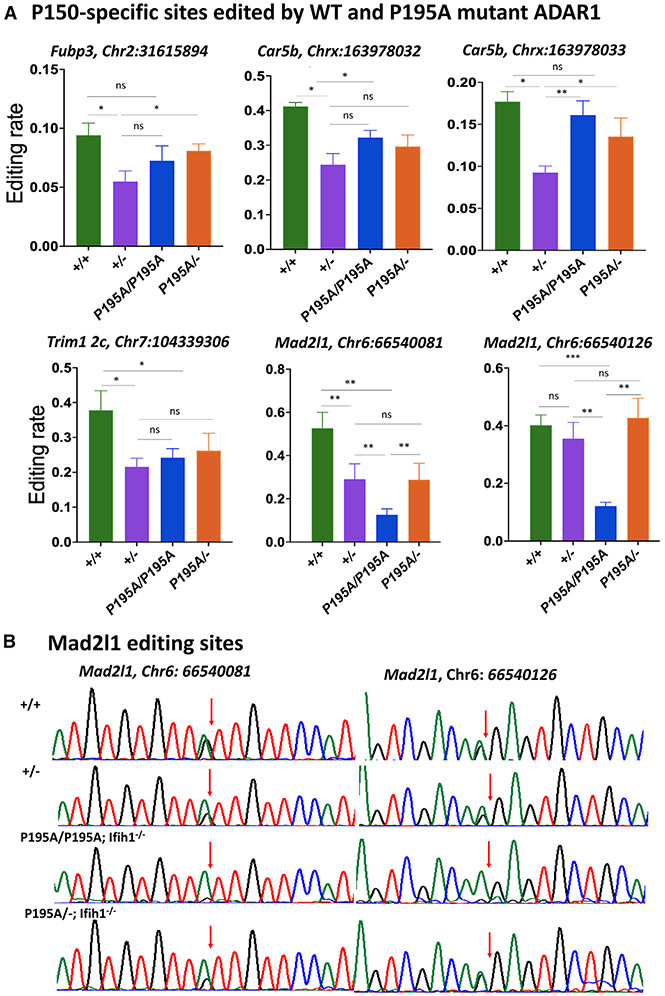
Figure 5. RNA editing at the P150-specific sites in AdarP195A/− and Adar1+/− mice.
(A) RNA-editing levels at typical ADAR1 p150 isoform-specific editing sites in Adar+/+, Adar+/−, AdarP195A/P195A; Ifih1−/−, and AdarP195A/−; Ifih1−/− mice were assessed, including the editing sites in the mRNAs of Fub3 (Chr2: 31615894), Trim12c (Chr7: 104339306), Car5b (Chrx: 163978032, 163978033), and Mad2l1 (Chr6: 66540081, 66540126). Except for the site of Mad2l1 (Chr6: 66540126), editing levels in in Adar+/− mice were significantly lower than those in Adar+/+ mice, whereas editing levels in AdarP195A/P195A; Ifih1−/− and AdarP195A/−; Ifih1−/− mice were the same as those in Adar+/− mice or between Adar+/+ mice and Adar+/− mice. Editing at the two sites in Mad2l1 mRNA (Chr6: 66540081, 66540126) were the only sites with significantly lower editing levels in AdarP195A/P195A; Ifih1−/− mice than those in Adar+/+, Adar+/-, and AdarP195A/−; Ifih1−/− mice, while editing at these two sites in AdarP195A/−; Ifih1−/− mice was not significantly different from Adar+/− and Adar+/+ mice. Shown in the figure are the average editing levels with SD values. n = 5 for all the groups. The nonparametric Wilcoxon rank-sum test was used to test the differences between the two groups. *p < 0.05, **p < 0.01.
(B) Different RNA-editing levels at the two specific sites in Mad2l1 mRNA (Chr6: 66540081, 66540126) in Adar+/+, Adar+/−, AdarP195A/P195A; Ifih1−/−, and AdarP195A/−; Ifih1−/− mice were shown by Sanger sequencing analysis. Shown here are the representative chromatograms of the editing sites. The arrows indicate the editing sites, and the editing level was calculated by the A and G peak values (G/(A + G)). Significantly decreased editing levels were observed in AdarP195A/P195A; Ifih1−/− mice.

