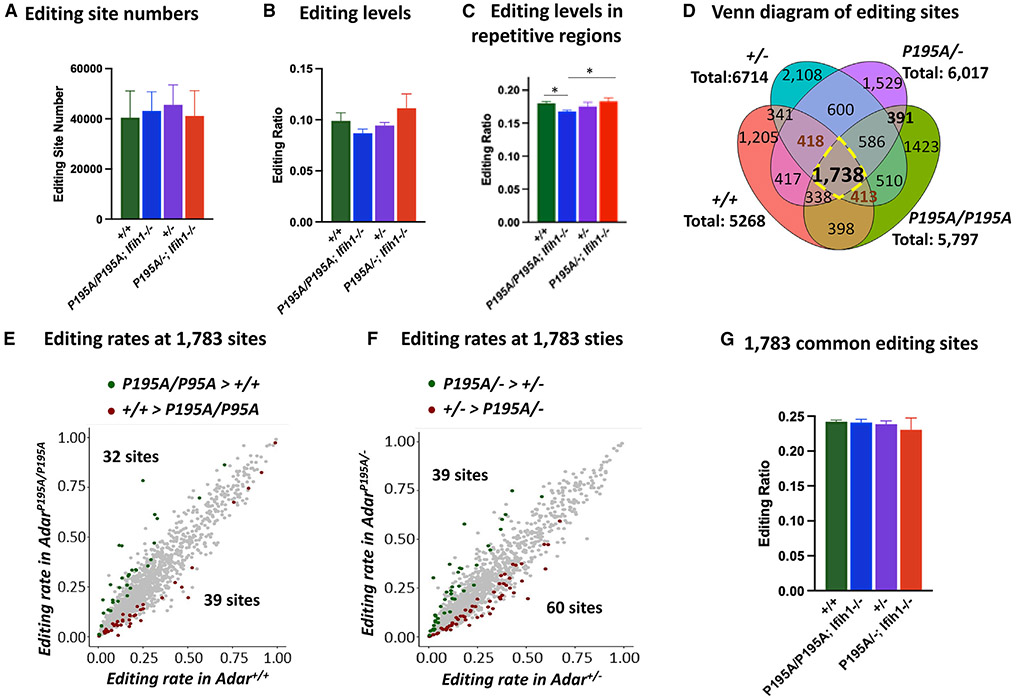
Figure 6. RNA editing assessed at whole-transcriptome level.
(A) High-throughput RNA sequencing (RNA-seq) study was performed with brain RNAs from Adar+/+, Adar+/−, AdarP195A/P195A; Ifih1−/−, and AdarP195A/−; Ifih1−/− mice. The numbers of RNA-editing sites identified in three mice of each genotype were compared. n = 3 for each group. Welch two-sample t test was used to test the differences between the two groups. No significant difference was observed in these four groups of mice.
(B) The average editing rates of all the editing sites in three mice of each genotype were compared, which showed no significant difference.
(C) The average editing rates of all the editing sites in repetitive sequences in three mice of each genotype were compared. The average editing rate in AdarP195A/P195A; Ifih1−/− mice was significantly lower than that in Adar+/+ and AdarP195A/−; Ifih1−/− mice but not significant compared with Adar+/− mice. For(A)–(C), the bars show the means of the three mice of each genotype, and the error bars are the corresponding SD values. n = 3 for each group. *p < 0.05, **<0.01 (Welch two-sample t test).
(D) The editing sites found in three mice of each genotype are compared in the Venn diagram. The total sites shown for each genotype are the shared editing sites found in all three mice of each genotype. Each genotype shows a unique selection of editing sites, with 1,738 editing sites shared by all the analyzed mice. Subgroups of the editing sites differ between the genotypes.
(E) Comparison of the editing rates of the 1,738 shared editing sites in AdarP195A/P195A; Ifih1−/− mice versus Adar+/+ mice; 32 sites were edited at significantly higher levels in AdarP195A/P195A; Ifih1−/− mice and 39 sites were edited significantly more in Adar+/+ mice.
(F) Comparison of the editing rates of the 1,738 shared editing sites in AdarP195A/−; Ifih1−/− mice versus Adar+/− mice; 39 sites were edited at significantly higher level in AdarP195A/−; Ifih1−/− mice and 60 sites were editing significantly more in Adar+/− mice.
(G) The average editing rates of the 1,783 editing sites in the Adar+/+, Adar+/−, AdarP195A/P195A; Ifih1−/−, and AdarP195A/−; Ifih1−/− mice were compared. The bars show the means of three mice of each genotype, and the error bars are the corresponding SD values. n = 3 for each genotype. Welch two-sample t test was used to test the differences between the two groups. No significant difference was observed in these four groups of mice.

