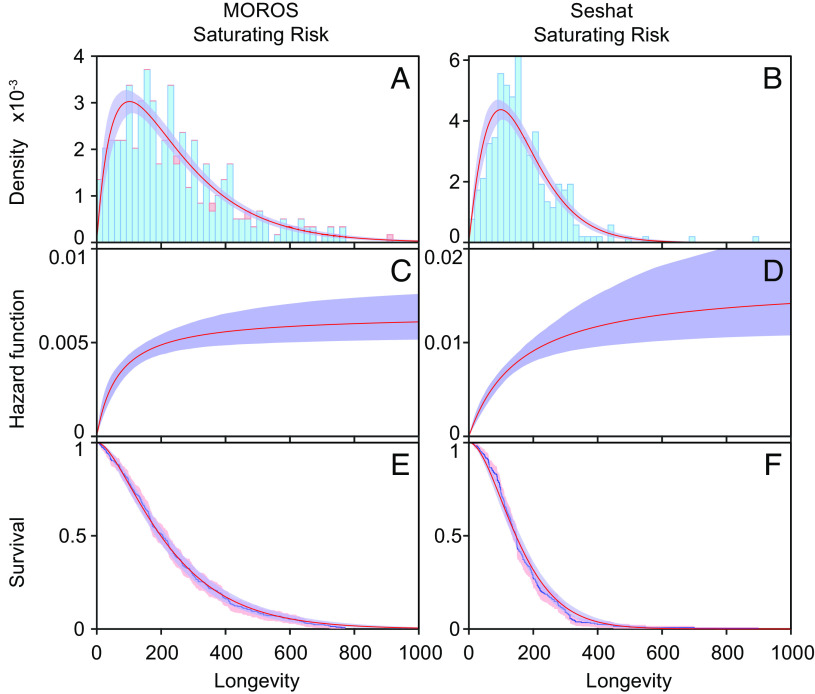
Fig. 4.
Observed longevity distributions compared to what might be expected from the best-fitting models in two sets of societies. (A, C, and E) Moros, (B, D, and F) Seshat. The optimized functions relating termination risk with age are represented in the Middle and surviving functions in Lower panels. Note that the uncertainty band of a nonparametrically derived survival function (orange zone around blue line) overlaps strongly with the fitted saturating risk function (blue zone around red line panel A). Shaded zones represent 95% uncertainty margins obtained from bootstrapping (SI Appendix, Supplementary Material 2). The ranges around the nonparametric distributions were determined using Greenwood’s formula (SI Appendix, Supplementary Material 2). Parameter values of the fitted hazard function: MOROS c = 0.0065 h = 67.3 (n = 324); Seshat: c = 0.0165 h = 161.4 (n = 291). For an analysis of the performance of other models, SI Appendix, Fig. S1C.

