

Significance
When the eyes move, the alignment between the visual and auditory scenes changes. We are not perceptually aware of these shifts—which indicates that the brain must incorporate accurate information about eye movements into auditory and visual processing. Here, we show that the small sounds generated within the ear by the brain contain accurate information about contemporaneous eye movements in the spatial domain: The direction and amplitude of the eye movements could be inferred from these small sounds. The underlying mechanism(s) likely involve(s) the ear’s various motor structures and could facilitate the translation of incoming auditory signals into a frame of reference anchored to the direction of the eyes and hence the visual scene.
Keywords: otoacoustic emissions, saccades, reference frames, coordinate transformations, sound localization
Abstract
Eye movements alter the relationship between the visual and auditory spatial scenes. Signals related to eye movements affect neural pathways from the ear through auditory cortex and beyond, but how these signals contribute to computing the locations of sounds with respect to the visual scene is poorly understood. Here, we evaluated the information contained in eye movement-related eardrum oscillations (EMREOs), pressure changes recorded in the ear canal that occur in conjunction with simultaneous eye movements. We show that EMREOs contain parametric information about horizontal and vertical eye displacement as well as initial/final eye position with respect to the head. The parametric information in the horizontal and vertical directions can be modeled as combining linearly, allowing accurate prediction of the EMREOs associated with oblique (diagonal) eye movements. Target location can also be inferred from the EMREO signals recorded during eye movements to those targets. We hypothesize that the (currently unknown) mechanism underlying EMREOs could impose a two-dimensional eye-movement-related transfer function on any incoming sound, permitting subsequent processing stages to compute the positions of sounds in relation to the visual scene.
Every time we move our eyes to localize multisensory stimuli, our retinae move in relation to our ears. These movements shift the alignment of the visual scene (as detected by the retinal surface) with respect to the auditory scene (as detected based on timing, intensity, and frequency differences in relation to the head and ears). Precise information about each eye movement is therefore needed to connect the brain’s views of visual and auditory space to one another (e.g., refs. 1–3). Most previous work about how eye movement information is incorporated into auditory processing has focused on cortical and subcortical brain structures (4–24), but the recent discovery of eye-movement-related eardrum oscillations (EMREOs) (25–28) suggests that the process might manifest much earlier in the auditory periphery. EMREOs can be thought of as a biomarker of underlying efferent information impacting the internal structures of the ear in association with eye movements. What information this efferent signal contains is currently uncertain.
We reasoned that if this efferent signal is to play a role in linking auditory and visual space across eye movements, EMREOs should be parametrically related to the associated eye movement. Specifically, EMREOs should vary in a regular and predictable fashion with both horizontal and vertical displacements of the eyes, and some form of information regarding the initial position of the eyes should also be present. These properties are required if the efferent signal underlying EMREOs is to play a role in linking hearing and vision. Notably, this parametric relationship is not required of alternative possible roles, such as synchronizing visual and auditory processing in time or enhanced attentional processing of sounds regardless of their spatial location (29–33).
Accordingly, we evaluated the parametric spatial properties of EMREOs in human participants by varying the starting and ending positions of visually guided saccades in two dimensions. We find that EMREOs do in fact vary parametrically depending on the saccade parameters in both horizontal and vertical dimensions and as a function of both initial eye position in the orbits and the change in eye position relative to that initial position. EMREOs associated with oblique (diagonal) saccades can be predicted by the linear combination of the EMREOs associated with strictly horizontal and vertical saccades. Furthermore, an estimate of target location can be decoded from EMREOs alone—i.e., where subjects looked in space can be roughly determined from their observed EMREOs.
These findings suggest that the eye movement information needed to accomplish a coordinate transformation of incoming sounds into a visual reference frame is fully available in the most peripheral part of the auditory system. While the precise mechanism that creates EMREOs remains unknown, we propose that the underlying mechanisms might introduce a transfer function to the sound transduction process that serves to adjust the gain, latency, and/or spectral dependence of responses in the cochlea. In principle, this could provide later stages of auditory processing access to an eye-centered signal of sound location for registration with the eye-centered visual scene (1), Indeed, recent work has shown that changes in muscular tension on the ossicular chain would be expected to affect gain and latency of sound transmission through the middle ear, thus supporting the plausibility of this hypothesis (34, 35).
Methods
We used earbud microphones to record internally generated oscillations in the ear canals of human subjects with normal hearing and corrected to normal vision. All procedures concerning human participants were approved by the Duke University Institutional Review Board, and all participants provided informed consent before beginning the experiments.
Participants performed eye movement tasks involving various visual fixation and target configurations (SI Appendix, Fig. S1). No external sounds were presented in any task. At the beginning of each trial, subjects fixated on a visual fixation point for a minimum of 200 ms and then made a saccade to a second target, which they then fixated on for another 200 ms (SI Appendix, Fig. S1A). Any trials with micro- or corrective saccades during the 200 ms prior to or following main fixation-point-to-target saccade were discarded, to ensure a stable baseline ear canal recording could be established without intrusions by other eye movements.
Additional methodological details can be found in SI Appendix.
Results
We first tested subjects (N = 10) on a task involving variation in both initial fixation position and target location along both horizontal and vertical dimensions—the “five-origin grid task”. Subjects fixated on an initial fixation light located either straight ahead, 9° left or right, or 6° up or down, and then made a saccade to a target located within an array of possible target locations spanning ±18° horizontally and ±12° vertically (Fig. 1, Inset and SI Appendix, Fig. S1B). Results of this task are shown in Fig. 1. Each panel shows the average microphone signal recorded in the left ear canal (averaged across all subjects) associated with saccades to a target at that location—e.g., the top right panel shows all saccades to the top right target location. The color and line styles of the waveforms correspond to the five initial fixation positions from which the saccades could originate in space.
Fig. 1.
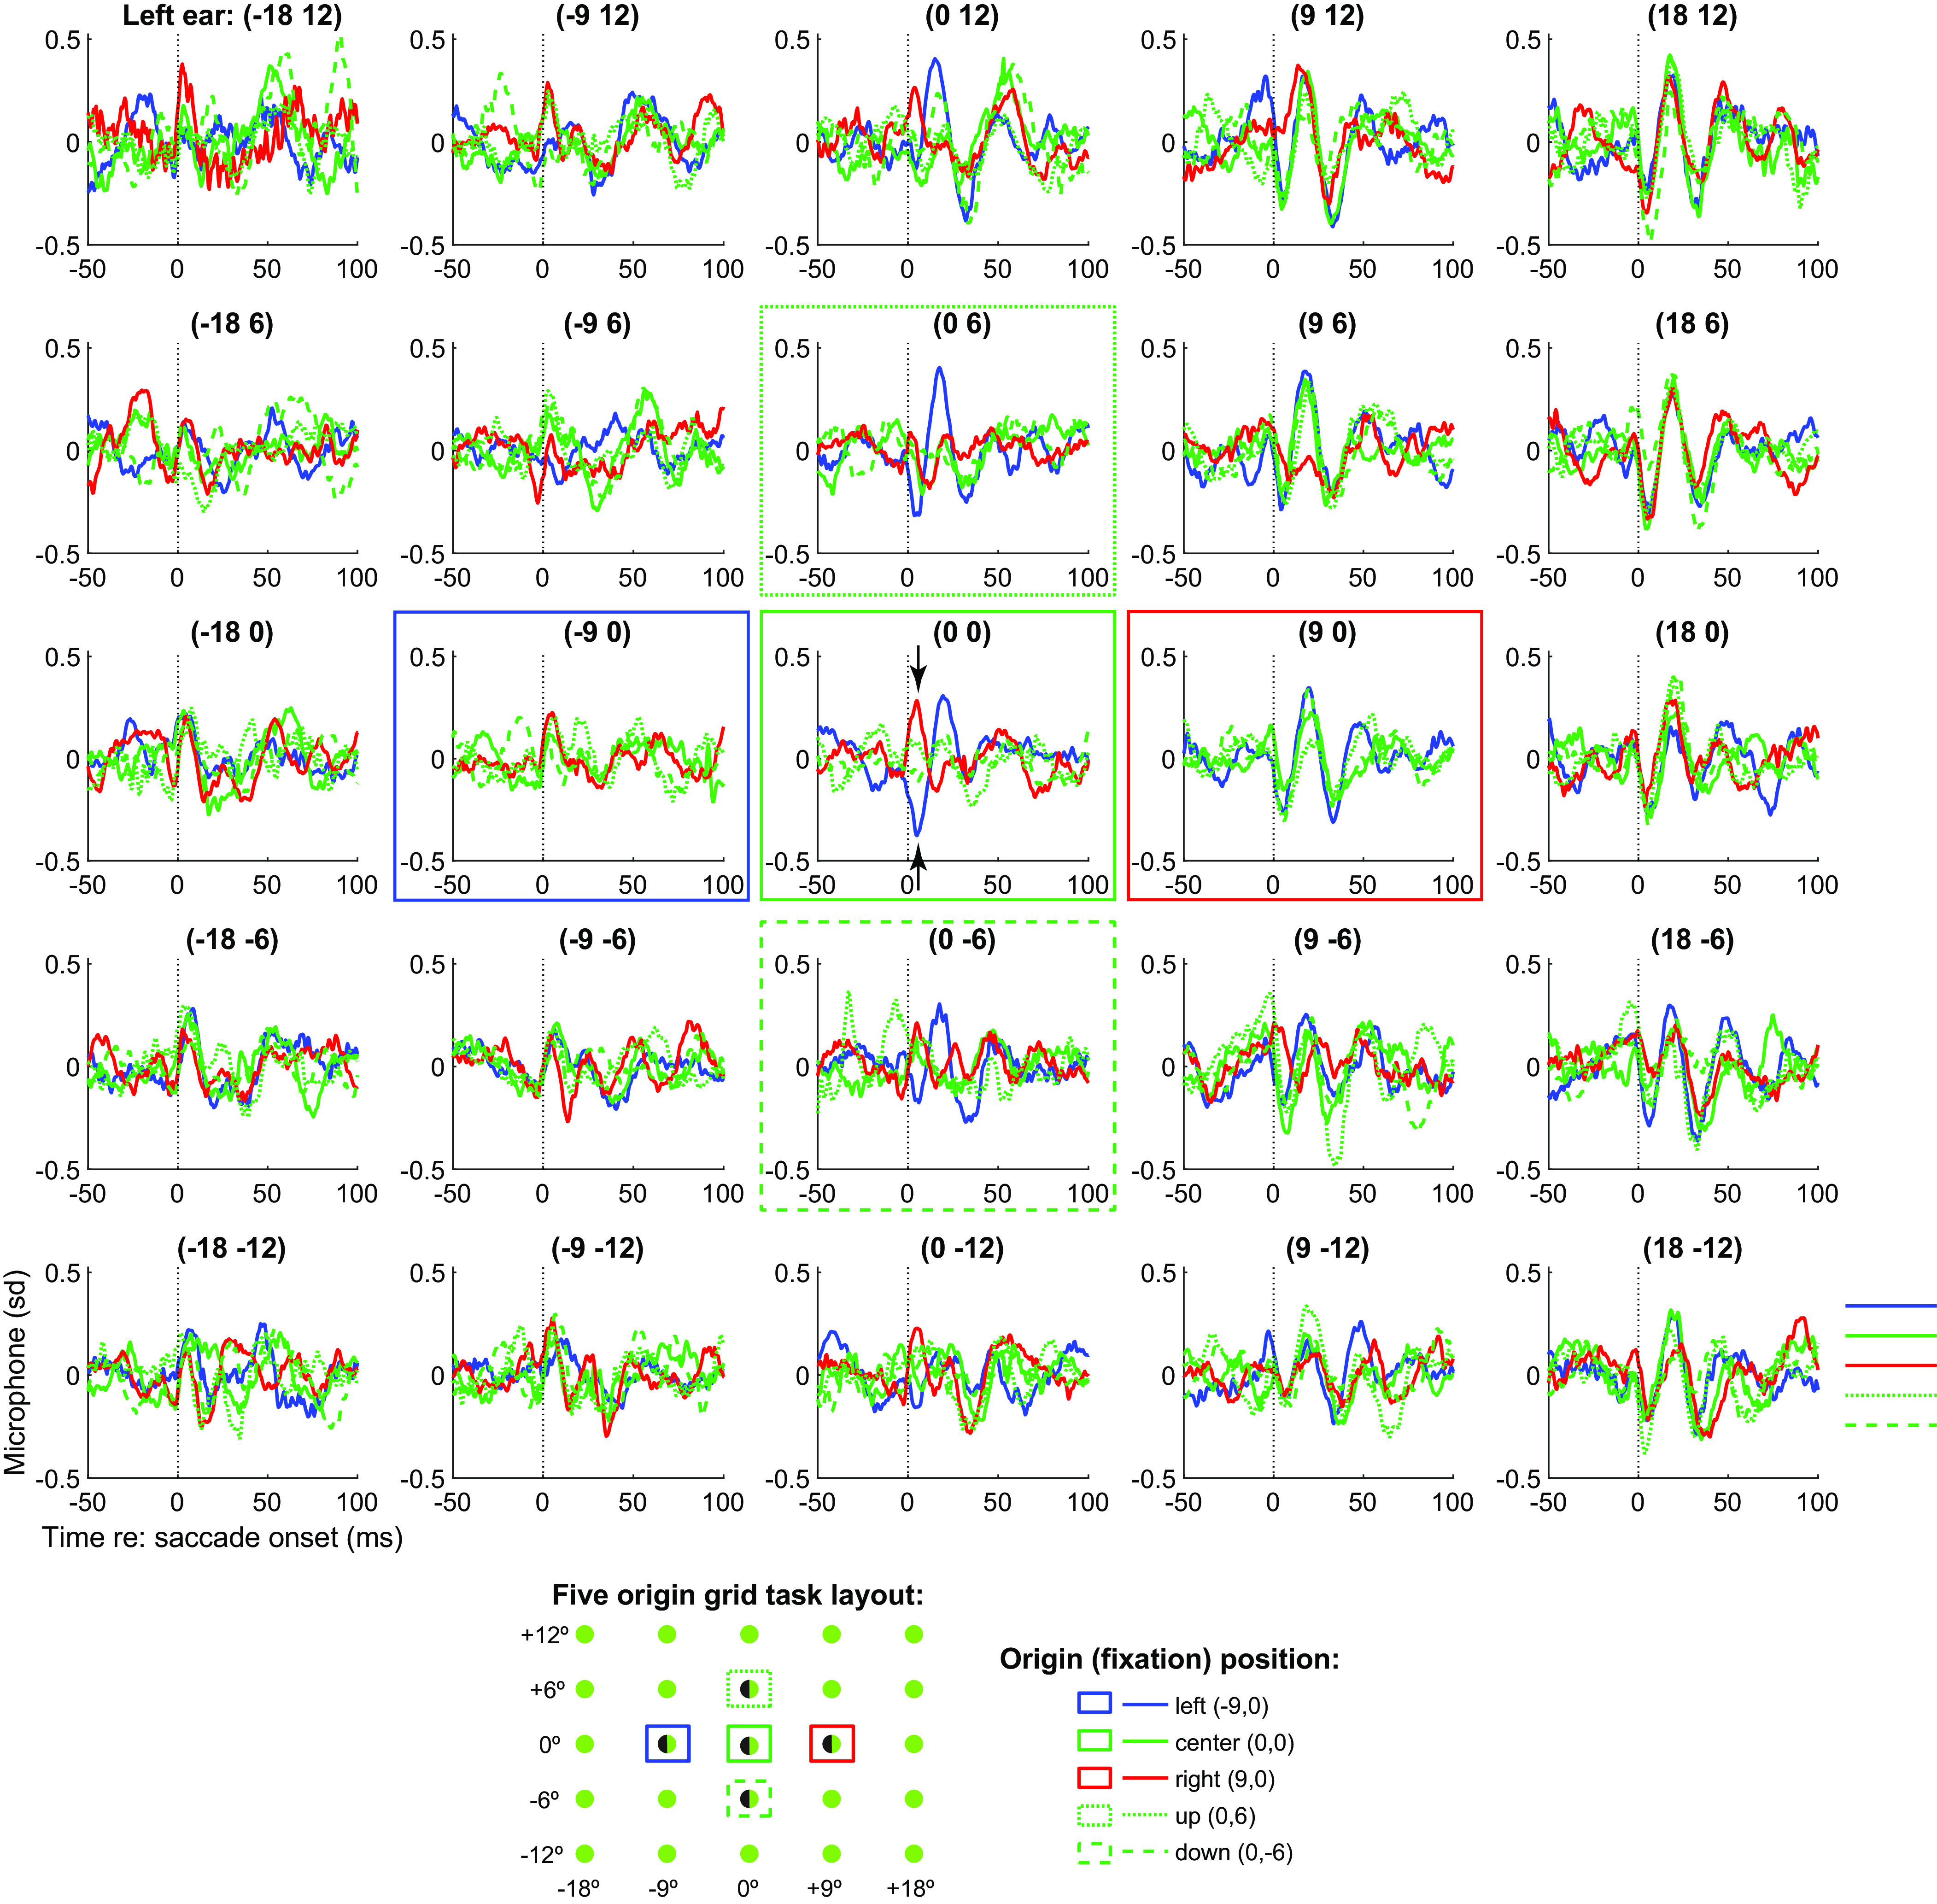
EMREOs recorded during the five-origin grid task. Each panel shows the grand average EMREO signal generated when saccades were made to that location on the screen (average of N = 10 subjects’ individual left ear averages). For example, the Top Right panel shows microphone recordings during saccades to the top right (contralateral) target location, and the color and line styles of each trace in that panel correspond to saccades from different initial fixation points. e.g., the red traces originated from the rightward fixation, the blue from the leftward fixation etc., as indicated by the legend and boxes of the same color and line style. Both magnitude and phase vary as a function of initial eye position and target location, with contralateral responses being larger than ipsilateral. Phase reversal occurs based on the location of the target with respect to the initial fixation position, as can be seen for the central target location (Central), where the EMREOs evoked for saccades from the rightward fixation (red traces) show an opposite phase relationship as those evoked for saccades from the leftward fixation (blue traces). Corresponding grand averages for right ear data are shown in SI Appendix, Fig. S3. These data are presented in Z-units; the peak-equivalent sound levels for 18 degree horizontal targets are roughly 55 to 56 dB SPL; see SI Appendix, Fig. S2 for the mean and distributions across the subject population (range ~49 to 64 dB SPL).
The first overall observation from this figure is that the magnitude of the waveform of the EMREO depends on both the horizontal and vertical dimensions. In the horizontal dimension, EMREOs are larger for more contralateral target locations: Compare the column on the right (contralateral) to the column on the left (ipsilateral). The pattern is reversed for right ear canal recordings (SI Appendix, Fig. S3). In the vertical dimension, EMREOs are larger for higher vs lower targets in both left and right ears (compare top row to bottom row in Fig. 1 and SI Appendix, Fig. S3).
The second overall observation from this figure is that the phase of the EMREO waveform depends on the horizontal location of the target with respect to the fixation position. Specifically, the first deflection after saccade onset is a peak for the most ipsilateral targets (left-most column) and trough for the most contralateral targets (right-most column). However, where this pattern reverses depends on the initial fixation position. Specifically, consider the red vs blue traces in the middle column of the figure, which correspond to targets along the vertical meridian. Red traces involve saccades to these targets from the fixation position on the right, and thus involve leftward (ipsiversive) saccades. The red traces in this column begin with a peak followed by a trough. In contrast, the blue traces involve saccades to these targets from the fixation position on the left, i.e., rightward or contraversive saccades. The blue traces begin with a trough followed by a peak. The pattern is particularly evident in the central panel (see arrows).
The phase reversal as a function of the combination of target location and initial eye position suggests that the EMREO waveforms might align better when plotted in an eye-centered frame of reference. Fig. 2 demonstrates that this is indeed the case: the data from Fig. 1 was replotted as a function of target location relative to the initial fixation position. The eight panels around the center represent the traces for the subset of targets that can be fully analyzed in an eye-centered frame, i.e., the targets immediately left, right, up, down, and diagonal relative to the five fixation locations. By plotting the data based on the relative location of the targets to the origins, the waveforms are better aligned, showing no obvious phase reversals.
Fig. 2.
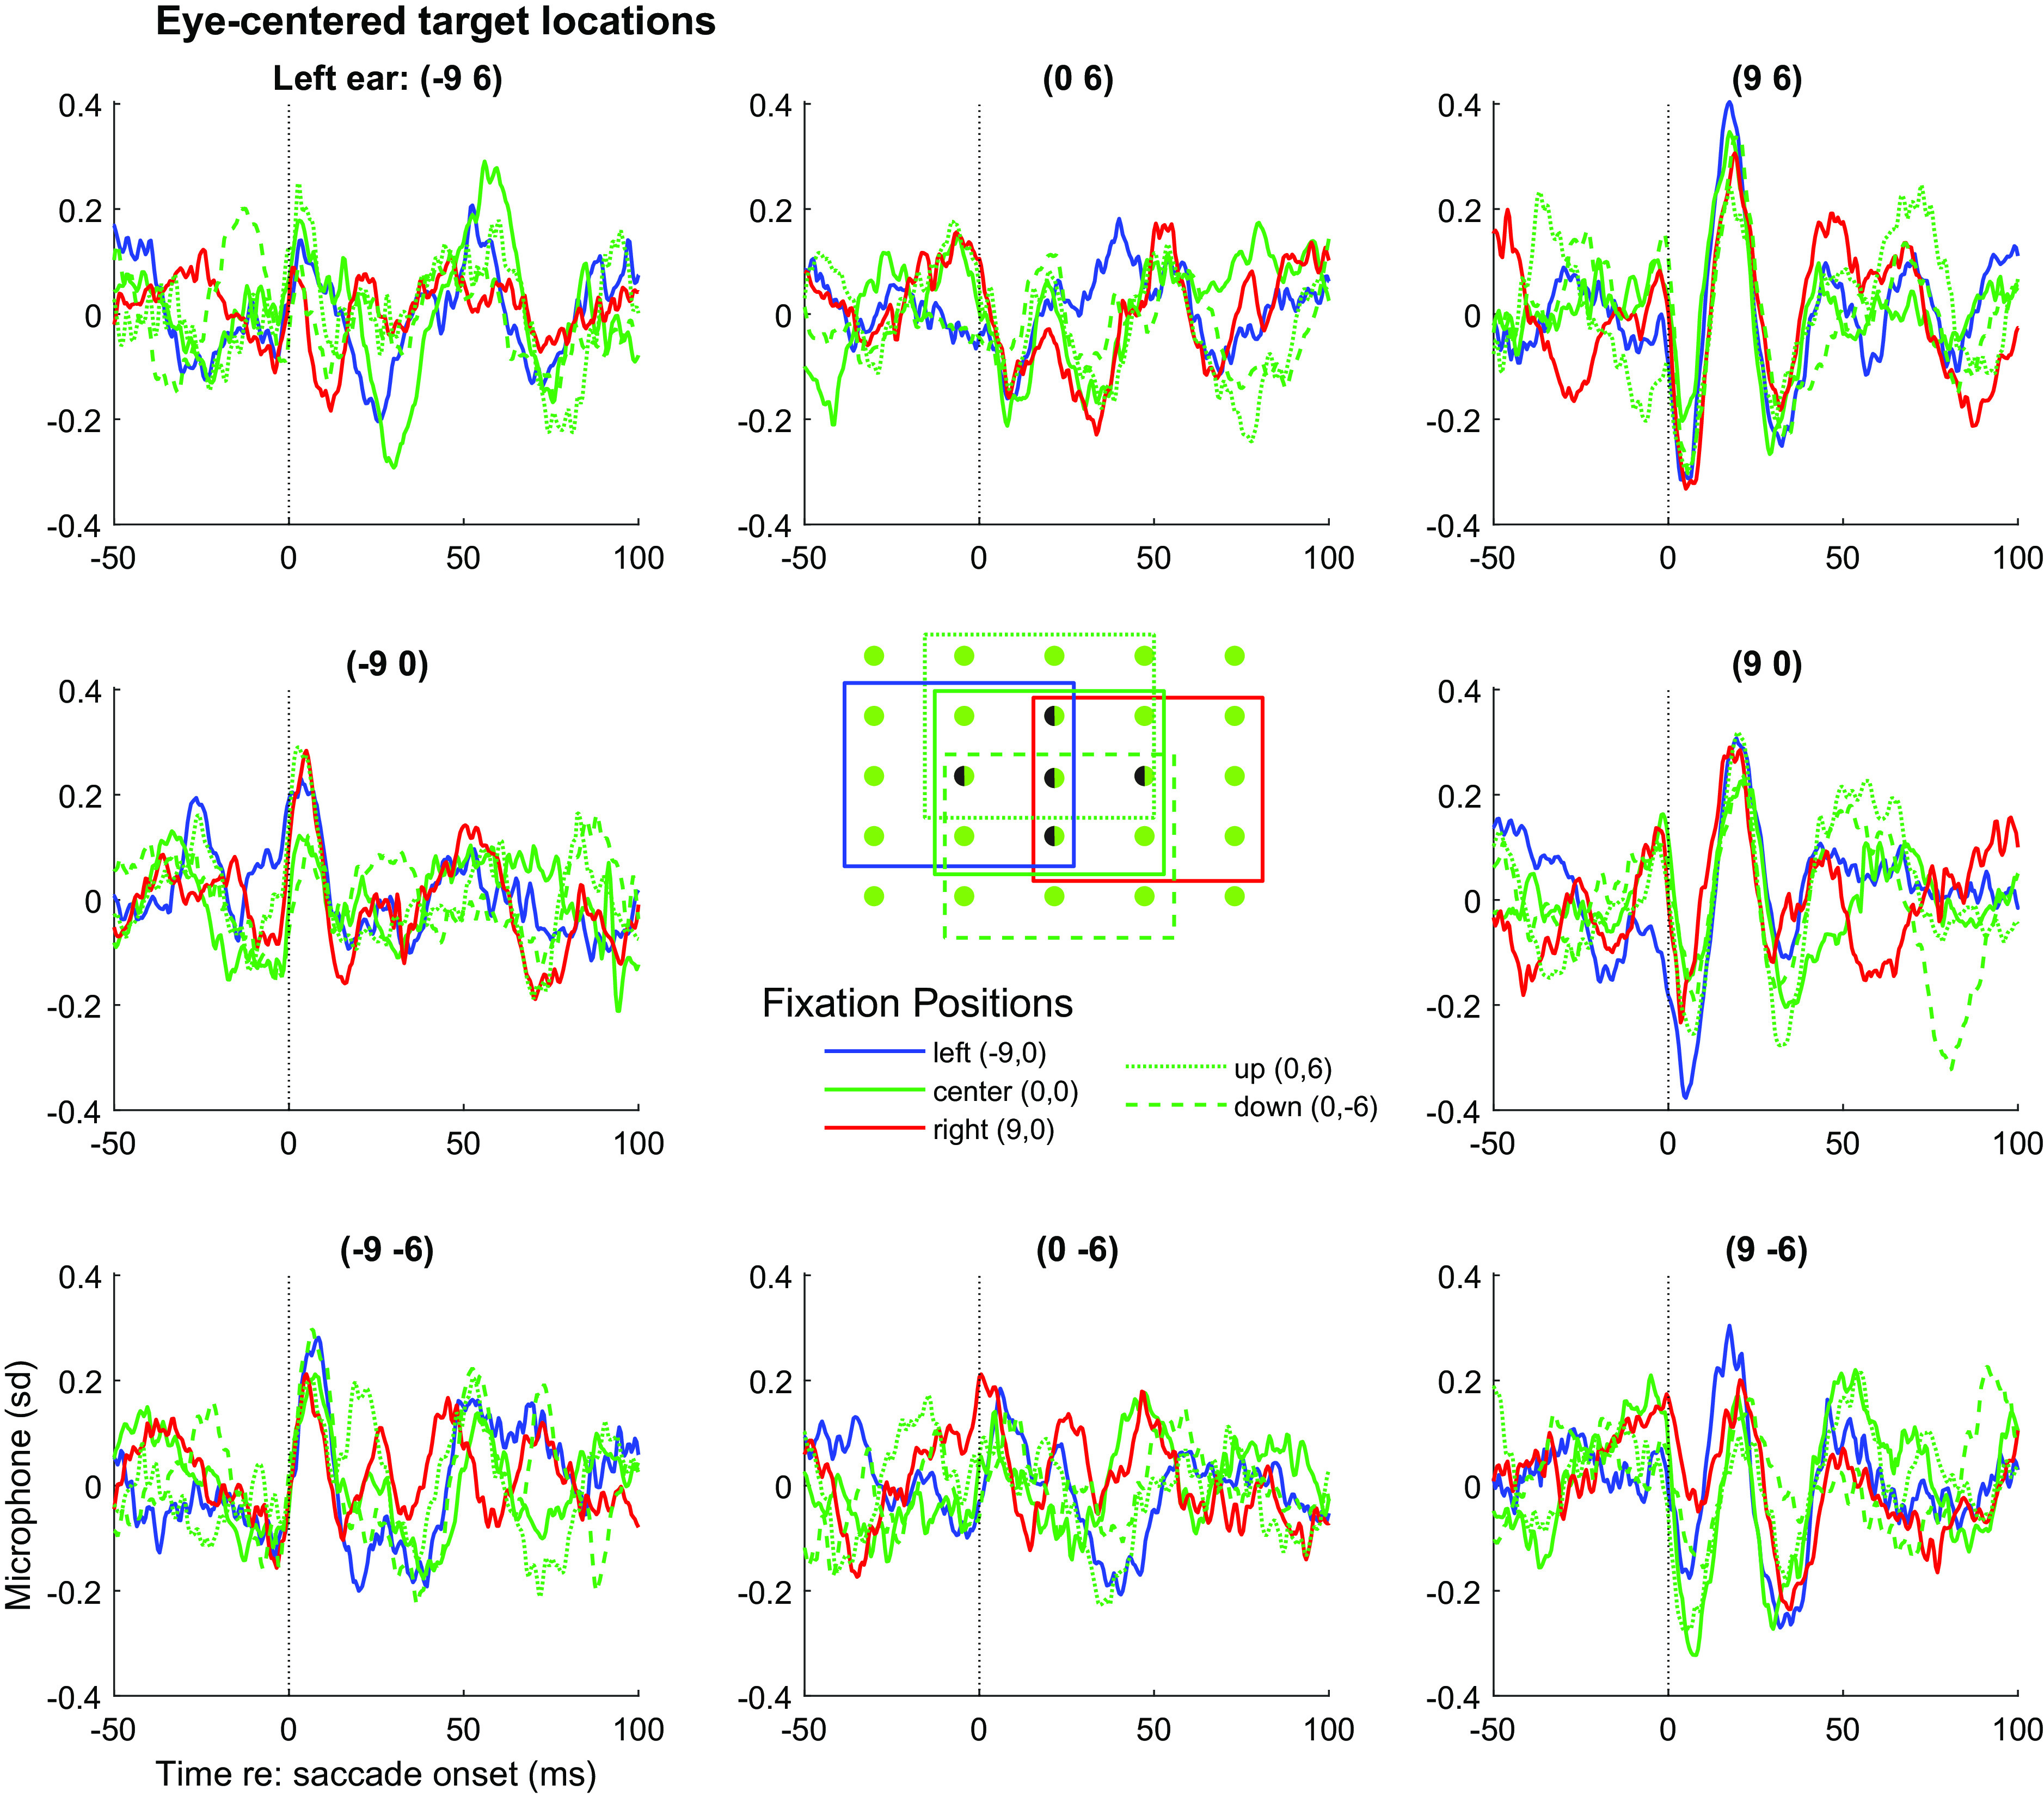
Replotting the grand average EMREOs as a function of relative target location shows better, but not perfect, correspondence of the EMREOs across different fixation positions. The data shown are a subset of those shown in Fig. 1, but here each panel location corresponds to a particular target location defined relative to the associated fixation position. The color/linestyle indicates the associated relative fixation position. For example, the waveforms in the upper right panel all involved 9° rightward and 6° upward saccades; the red trace in that panel indicates those that originated from the 9° right fixation; the blue those from the 9° left fixation etc. Only relative target locations that existed for all 5 fixation positions are plotted, as indicated by the inset. Corresponding right ear data are shown in SI Appendix, Fig. S4.
Although the waveforms are better aligned when plotted based on target location relative to initial eye position, some variation related to that fixation position is still evident in the traces. That is, in each panel, the EMREO waveforms with different colors/line styles (corresponding to different fixation positions) do not necessarily superimpose perfectly. This suggests that a model that incorporates both relative target position and original fixation position, in both horizontal and vertical dimensions, is needed to account for the findings. Furthermore, a statistical accounting of these effects is needed. Accordingly, we fit the data to the following regression equation:
| [1] |
where H and V correspond to the initial horizontal and vertical eye position and ΔH and ΔV correspond to the respective changes in position associated with that trial. The slope coefficients BH, BΔH, BV, and BΔV are time-varying and reflect the dependence of the microphone signal on the respective eye position/movement parameters. The term C(t) contributes a time-varying “constant” independent of eye movement metric and can be thought of as the best-fitting average oscillation across all initial eye positions and changes in eye position. We used the measured values of eye position/change in eye position for this analysis rather than the associated fixation and target locations so as to incorporate trial-by-trial variability in fixation and saccade accuracy.
This model is a conservative one, assessing whether a linear relationship between the microphone signal and the relevant eye position/movement variables can provide a satisfactory fit to the data. As such, it provides a lower bound but does not preclude that higher quality fits could be achieved via nonlinear modeling. This approach is similar to the general linear models applied to fMRI data (e.g., ref. 36) and differs chiefly in that we make no assumptions about the underlying temporal profile of the signal (such as a hemodynamic response function) but allow the temporal pattern to emerge in the time-varying fits of the coefficients.
Fig. 3 shows the average of these time-varying values of the slope coefficients across subjects (blue = left ear; red = right ear) and provides information about the contribution of these various eye movement parameters to the EMREO signal. A strong, consistent dependence on horizontal eye displacement is observed, consistent with our previous report (Fig. 3A) (25). This component is oscillatory and begins slightly before the onset of the eye movement, inverting in phase for left vs right ears. The thickened parts of the line indicate periods of time when this coefficient differed significantly from 0 with 95% confidence (shaded areas are ±SEM). There is also an oscillatory and binaurally phase-inverting signal related to the initial position of the eyes in the horizontal dimension (Fig. 3B). This signal is smaller and more variable across subjects.
Fig. 3.

Regression analysis of EMREOs shows contributions from multiple aspects of eye movement: horizontal change-in-eye position (A), horizontal initial eye position (B), and vertical change-in-eye-position (C). The contribution of vertical initial eye position was weaker (D). Finally, the constant component showed a contribution that was also consistent across saccades (E). The regression involved modeling the microphone signal at each time point, and each panel shows the time varying values of the coefficients associated with the different aspects of the eye movement (horizontal vs. vertical, change-in-position and initial position). The regressions were fit to individual subjects’ microphone recordings and plotted here as grand averages of these regression coefficients across the N = 10 subjects tested in the 5-origin grid task. Microphone signals were z-scored in reference to baseline variability during a period −150 to 120 ms prior to saccade onset. Results are presented in units of SD (panel E) or SD per degree (panels A–D). Shaded areas represent ±SEM.
In the vertical dimension, the effect of vertical saccade amplitude is in phase for both the left and right ears; it exhibits an oscillatory pattern, although not obviously sinusoidal like the one observed for the horizontal saccade amplitude. Initial position of the eyes in the vertical dimension exerts a variable effect across participants such that it is not particularly evident in this grand average analysis; this may be related to poorer abilities to localize sounds in the vertical vs. horizontal dimensions (37–40).
Finally, there is a constant term that is similar in the two ears and peaks later with respect to saccade onset than is the case for the other coefficients (Fig. 3E). As noted above, this constant term can be thought of as encapsulating the average EMREO waveform that occurs when pooling across all the eye movements in the dataset, regardless of their initial positions or horizontal or vertical components.
We next investigated whether the fits obtained in one task match those obtained in a different task. We reasoned that if the information contained in the EMREO signal reflects the eye movement itself, then task context should not matter. Furthermore, the regression model should provide a good way to accomplish this comparison since it does not require that the exact same locations and eye movements be tested across tasks.
To test these questions, we collected data using two simplified tasks, the single-origin-grid task (with a single initial fixation in the center, SI Appendix, Fig. S1C) and the horizontal/vertical task (with a single fixation at the center and targets on the horizontal and vertical meridians, generating purely horizontal or vertical saccades, SI Appendix, Fig. S1D). Ten subjects (four of whom also completed the 5-origin grid task) completed both the single-origin grid task and the horizontal/vertical saccade. We fit the results from these tasks using the same regression procedure but omitting the initial fixation position terms, i.e.:
| [2] |
As shown in Fig. 4, both tasks yield similar values of the regression coefficients for horizontal change-in-position (BΔH(t)) and the constant term (C(t)) (grand average across the population, black vs. green traces). The vertical change-in-position term (BΔV(t)) was slightly more variable but also quite consistent across tasks.
Fig. 4.
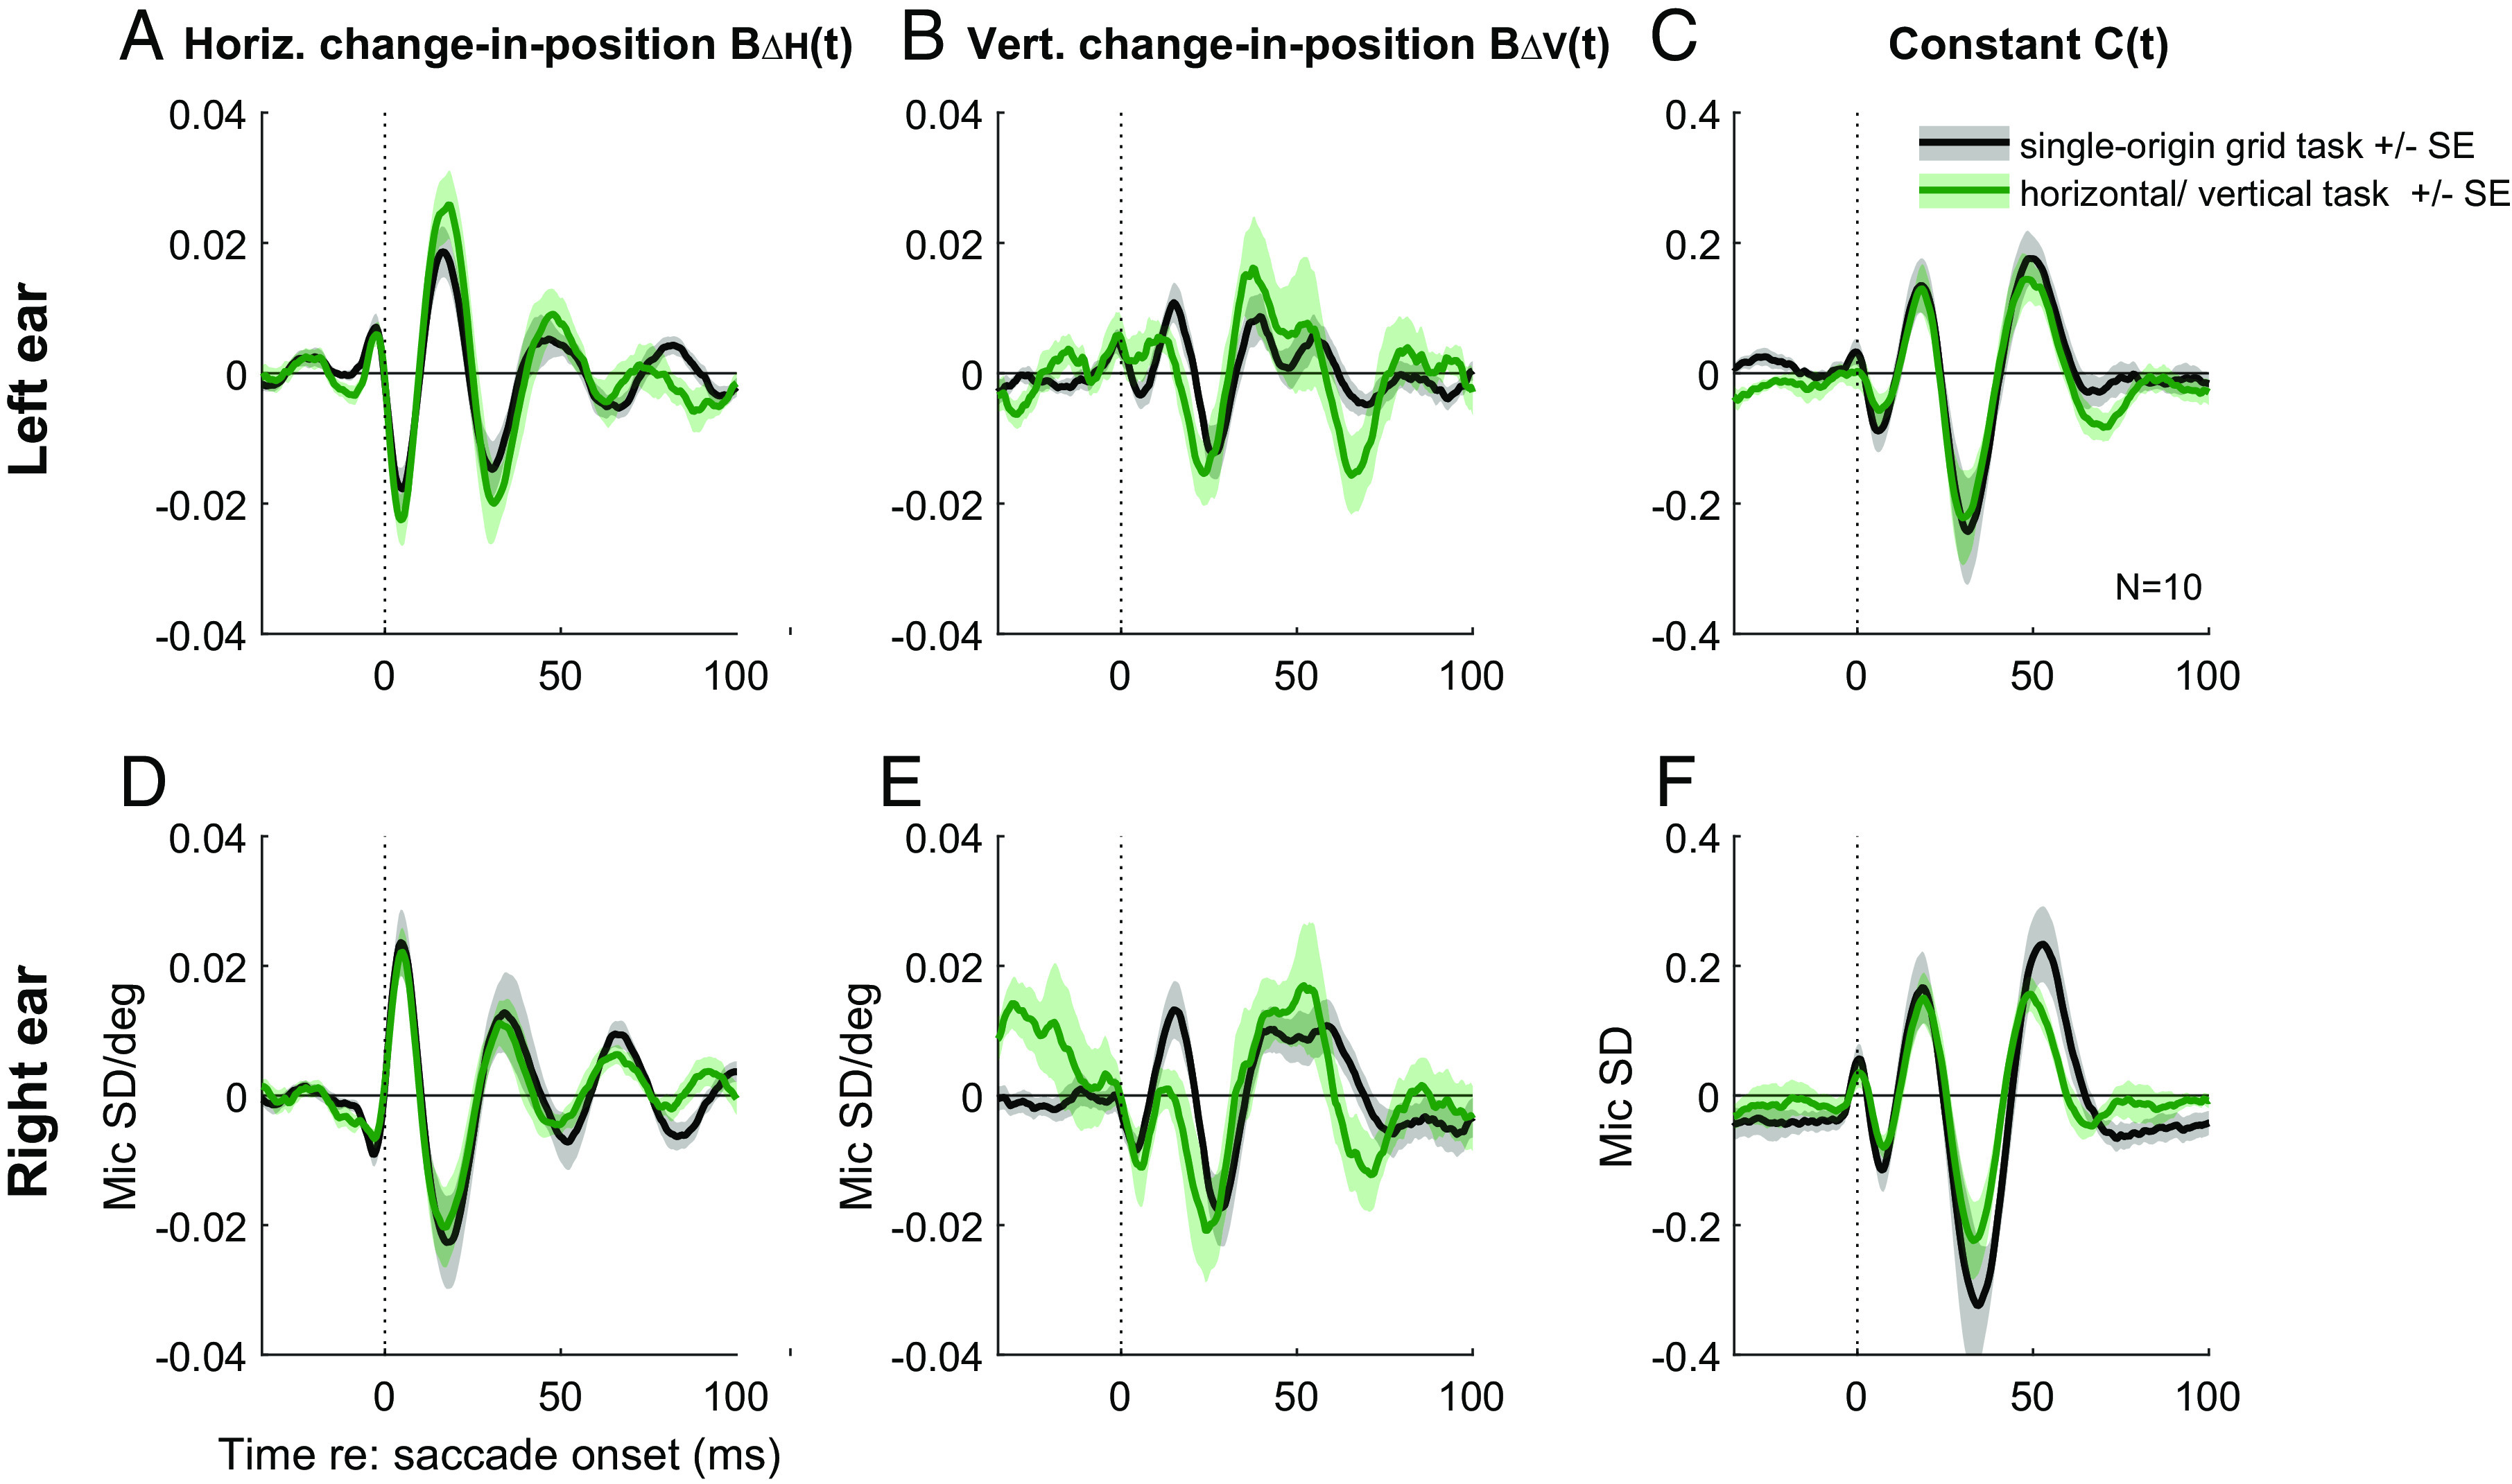
Different tasks generate similar regression coefficient curves. Grand average of the regression results for the single-origin grid (black lines) and horizontal/vertical (green lines) tasks. The horizontal change-in-position (A), the vertical change in position (B), and the constant component (C) are shown for the left ear. The lines and shading represent the average and SE of the coefficient values across the same 10 subjects for the two tasks. The same information is also shown for the right ear (D–F).See SI Appendix, Fig. S5 for corresponding findings among the individual subjects.
Given the consistency of the regression coefficient values between the single-origin grid and horizontal/vertical tasks (and see ref. 26) for similar results involving spontaneous vs. task-guided eye movements), we surmised that it should be possible to use the coefficient values from one task to predict the EMREO waveforms in the other. Specifically, we used the time-varying regression values from purely horizontal and purely vertical saccades in the horizontal/vertical task to predict the observed waveforms from oblique saccades in the single origin grid task. This method can be used to evaluate the quality of the regression-based EMREO prediction not only for target locations tested in both tasks, i.e., the horizontal and vertical meridians, but also for oblique targets tested only in the grid task.
The black traces in Fig. 5 show the grand average microphone signals associated with each target in the single-origin grid task. The location of each trace corresponds to the physical location of the associated target in the grid task (similar to Fig. 1). The superimposed predicted waveforms (red traces) were generated from the BΔH(t), BΔV(t), and C(t) regression coefficients fit to only the horizontal/vertical data and then evaluated at each target location and moment in time to produce predicted curves for each of the locations tested in the grid task.
Fig. 5.

Regression coefficients fit to microphone recordings from the horizontal/vertical-saccade task can be used to predict the waveforms observed in the grid task and their corresponding target locations. Combined results for all N = 10 participants’ left ears. The black traces indicate the grand average of all the individual participants’ mean microphone signals during the single-origin grid task, with the shading indicating ± the SE across participants. The red traces show an estimate of the EMREO at that target location based only on regression coefficients measured from the horizontal/vertical task. Black values in parentheses are the actual horizontal and vertical coordinates for each target in the grid task. Corresponding red values indicate the inferred target location based on solving a multivariate regression which fits the observed grid task microphone signals in a time window (−5 to 70 ms with respect to saccade onset) to the observed regression weights from the horizontal/vertical task for each target location. The averages of these values in the horizontal and vertical dimensions are shown across the top and right sides. See Fig. 6 for additional plots of the inferred vs actual target values and SI Appendix, Fig. S6 for corresponding right-ear data.
Overall, there is good correspondence between the predicted EMREO oscillations and the observed EMREO from actual microphone recordings, including the oblique target locations that were not tested in the horizontal/vertical task. This illustrates two things: 1) The EMREO is reproducible across task contexts, and 2) the horizontal and vertical change-in-position contributions interact in a reasonably independent way, so that the EMREO signal observed for a combined horizontal-vertical saccade can be predicted as the sum of the signals observed for purely horizontal and purely vertical saccades with the corresponding component amplitudes.
Given that it is possible to predict the microphone signal from one task context to another, it should also be possible to decode the target location associated with an eye movement from just the simultaneously recorded microphone signal. To do this, we again used the weights from the horizontal/vertical task data for the regression equation (refer to equation 2 above).
| [2] |
Specifically, we used the Mic(t) values observed in the single-origin grid task to solve this system of multivariate linear equations across the time window −5 to 70 ms with respect to the saccade (a time period in which the EMREO appears particularly consistent and substantial in magnitude) to generate the “read out” values of ΔH and ΔV associated with each target’s actual ΔH and ΔV. We conducted this analysis on the left ear and right ear data separately. The left ear results of this analysis are seen in each of the individual panels of Fig. 5; the black values (e.g., −18, 12) indicate the actual horizontal and vertical locations of the target, and the associated red values indicate the inferred location of the target. Across the top of the figure, the numbers indicate the average inferred horizontal location, and down the right side, the numbers indicate the average inferred vertical location. These results indicate that, on average, the targets can be read out in the proper order, but the spatial scale is compressed: The average read-out values for the ±18 degree horizontal targets are ± ~11 to 12 degrees, and the averages for the vertical ±12 degree targets are ± ~6 to 7 degrees. Similar patterns occurred for the right ear data (SI Appendix, Fig. S6).
Plots of these target readouts in both horizontal and vertical dimensions for both ears are shown in Fig. 6 A–F. Fig. 6A shows the inferred location of the target (red dots) connected to the actual location of the target (black dots) using the data from Fig. 5, i.e., the left ear readout, and Fig. 6 B and C shows regressions of these target readouts as a function of the horizontal and vertical locations. Fig. 6 D–F shows the corresponding results for the right ears. Altogether, these figures illustrate that the readout accuracy is better in the horizontal than in the vertical dimensions. Quantitatively, the r2 values for the horizontal dimension were 0.89 (LE) and 0.91 (RE), and the corresponding values for the vertical dimension were 0.61 (LE) and 0.67 (RE). Slopes were also closer to a value of 1 (the ideal) for the horizontal dimension (0.71, LE; 0.77, RE) than for the vertical dimension (0.51, LE, 0.51, RE).
Fig. 6.
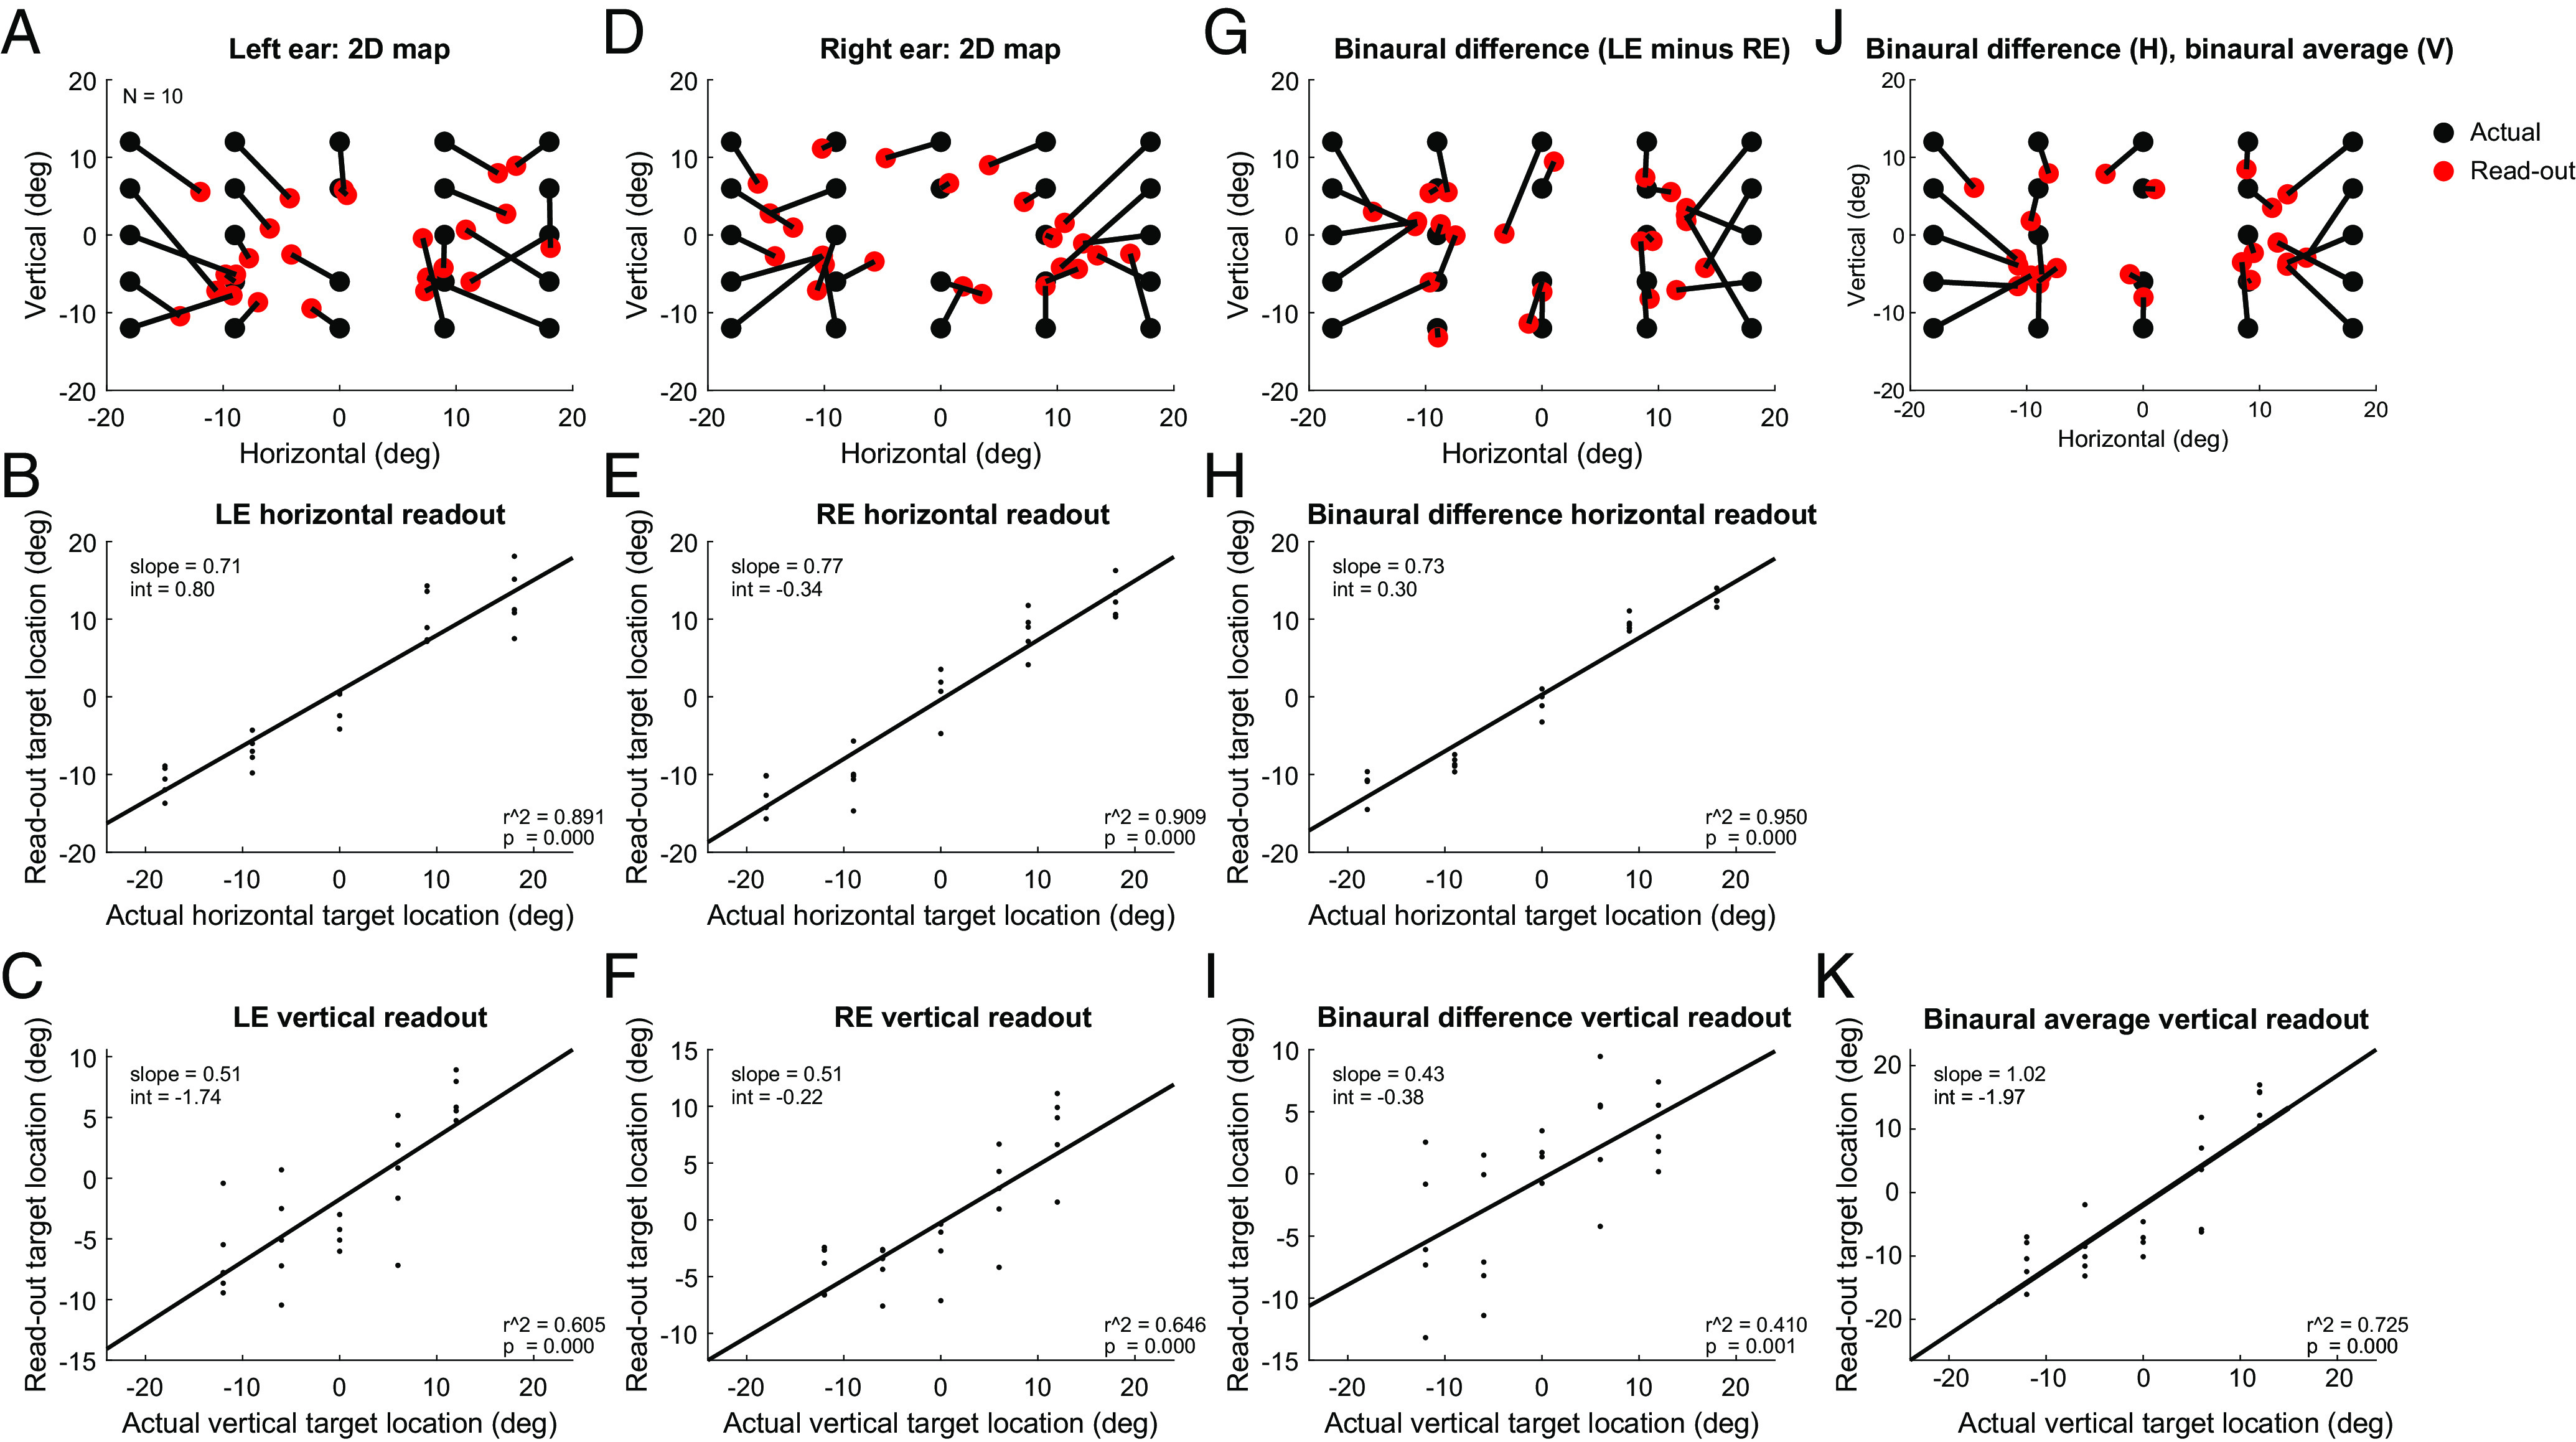
Multiple ways of reading out target location from the ear canal recordings. As in Fig. 5 and SI Appendix, Fig. S6, the relationship between EMREOs and eye movements was quantitatively modelled using Eq. 2 and the ear canal data recorded in the horizontal/vertical task. Inferred grid task target location was read out by solving Eq. 2 for ΔH and ΔV using the coefficients as fit from the horizontal/vertical task and the microphone values as observed in the single-origin grid task; see main text for details. (A) Inferred target location (red) compared to actual target location (black), based on the left ear (same data as in Fig. 5). (B) Horizontal component of the read-out target vs the actual horizontal component (left ear microphone signals). (C) Same as (B) but for the vertical component. (D–F) Same as A–C but for the right ear. (G–I) Same as (A–C) and (D–F) but computed using the binaural difference between the microphone signals (left ear—right ear). (J and K) A hybrid read-out model (J) using binaural difference in the horizontal dimension (H) and binaural average in the vertical dimension (K). Related findings at the individual subject level are provided in SI Appendix, Fig. S7.
Given that it is known that the brain uses binaural computations for reconstructing auditory space, we wondered whether the accuracy of this read-out could be improved by combining signals recorded in each ear simultaneously. We first considered a binaural difference computation, subtracting the right ear microphone recordings from the left, thus eliminating the part of the signal that is common between the two ears. Fig. 6G shows the results. Generally, the horizontal dimension is well ordered, whereas the vertical dimension continues to show considerable shuffling. This can also be seen in Fig. 6 H and I, which show the relationship between the inferred target location and the true target location, plotted on the horizontal and vertical dimension, respectively. The correlation between inferred and actual target is higher in the horizontal dimension (r2 0.95) than the vertical dimension (r2 0.41), which is actually worse than the monaural readouts. This makes sense because the binaural difference computation serves to diminish the contribution from aspects of the signal that are in phase across the two ears, such as the dependence on vertical change in eye position. We then reasoned that improvement in the vertical readout could be achieved by instead averaging, rather than subtracting, the signals across the two ears, and indeed this is so: averaging across the two ears produces an improved vertical readout (r2 0.73, Fig. 6K). Finally, a hybrid readout operation in which the horizontal location is computed from the binaural difference, and the vertical location is computed from the binaural average, produces an additional modest improvement, yielding the best overall reconstruction of target location (Fig. 6J).
We next considered how well this readout operation performed at the level of individual subjects. Results for each subject are shown in SI Appendix, Fig. S7 A–J, and a population summary is shown in SI Appendix, Fig. S7K. The relationship between the inferred location and the actual location was statistically significant (P < 0.05) for all 10 subjects in the horizontal dimension, and for 7 of 10 subjects in the vertical dimension. This confirms that we can predict the horizontal location of the target of a saccade from ear recordings in each individual subject, and the vertical location can be predicted for most, but not all, subjects.
Finally, we evaluated the error when reading out the target location of individual trials. The preceding analyses show the results when the readout operation is performed on the average waveform observed across trials for a given target location. The same readout can also be computed for each individual trial. When conducted on all individual trials, the resulting scatter can be computed as the average SD observed across target locations and subjects. We found that the average scatter or SD was 19.1 degrees in the horizontal dimension and 23.8 degrees in the vertical dimension. For the horizontal dimension, this corresponds roughly half of the range of space tested (±18 degrees), whereas in the vertical dimension, this corresponds to nearly the whole range (±12 degrees).
Overall, these results parallel human sound localization which relies on a binaural difference computation in the horizontal dimension (and is more accurate in that dimension) vs. potentially monaural or averaged spectral cues for the vertical dimension (which is less accurate) (41, 42). Indeed, horizontal and vertical sound localization show different patterns of dependence on the loudness of the target sound relative to background noise, further supporting that these operations are accomplished via distinct mechanisms (43).
Discussion
Sound locations are inferred from head-centered differences in sound arrival time, intensity, and spectral content, but visual stimulus locations are inferred from eye-centered retinal locations (41, 42). Information about eye movements with respect to the head/ears is critical for connecting the visual and auditory scenes to one another (1). This insight has motivated a number of previous neurophysiological studies in various brain areas in monkeys and cats, all of which showed that changes in eye position affected the auditory response properties of at least some neurons in the brain area studied [Inferior colliculus: (8–12); auditory cortex: (5–7); superior colliculus: (18–24); frontal eye fields: (13, 44); intraparietal cortex: (14–17)].
These findings raised the question of where signals related to eye movements first appear in the auditory processing stream. The discovery of EMREOs (25–28, 45) introduced the intriguing possibility that the computational process leading to visual-auditory integration might be manifested in the most peripheral part of the auditory system. Here, we show that the signals present in the ear exhibit the properties necessary for playing a role in this process: These signals carry information about the horizontal and vertical components of eye movements and display signatures related to both change-in-eye-position and the absolute position of the eyes in the orbits. Because of the parametric information present in the EMREO signal, we were able to predict EMREOs in one task from the EMREOs recorded in another and even predict the target of eye movements from the simultaneous EMREO recording. These predictions were accomplished using strictly linear methods, a conservative approach providing a lower bound on what can be deduced from these signals. Improvements in the “readout” may come from exploration of more powerful nonlinear techniques and/or other refinements such as tailoring the time window used for the readout (here, a generous −5 to 70 ms) or stricter criteria for the exclusion of trials contaminated by noise (see “Methods: Trial exclusion criteria”). It should be noted that this read-out presumes knowledge of when the saccade starts and that performance would be substantially poorer if conducted in a continuous fashion across time.
Our present observations raise two key questions: what causes EMREOs and how do those mechanisms impact hearing/auditory processing? The proximate cause of EMREOs is likely to be one or more of the known types of motor elements in the ear*: the middle ear muscles (stapedius and tensor tympani), which modulate the motion of the ossicles (46–48), and the outer hair cells, which modulate the motion of the basilar membrane (49). One or more of these elements may be driven by descending brain signals originating from within the oculomotor pathway and entering the auditory pathway somewhere along the descending stream that ultimately reaches the ear via the 5th (tensor tympani), 7th (stapedius muscle), and/or 8th nerves (outer hair cells) (see refs. 50–55 for reviews). Efforts are currently underway in our laboratory to identify the specific EMREO generators/modulators (56–58).
Uncovering the underlying mechanism should shed light on another question. Does the temporal pattern of the observed EMREO signal reflect the time course and nature of that underlying mechanism’s impact on auditory processing? It is not clear how an oscillatory signal like the one observed here might contribute to hearing. However, it is also not clear that the underlying mechanism is, in fact, oscillatory. Microphones can only detect signals with oscillatory energy in the range of sensitivity of the microphone. It is possible that the observed oscillations reflect ringing associated with a change in some mechanical property of the transduction system and that change could have a nonoscillatory temporal profile (Fig. 7A). Of particular interest would be a ramp-to-step profile in which aspects of the middle or inner ear shift from one state to another during the course of a saccade and hold steady at the new state during the subsequent fixation period. This kind of temporal profile would match the time course of the saccade itself.
Fig. 7.
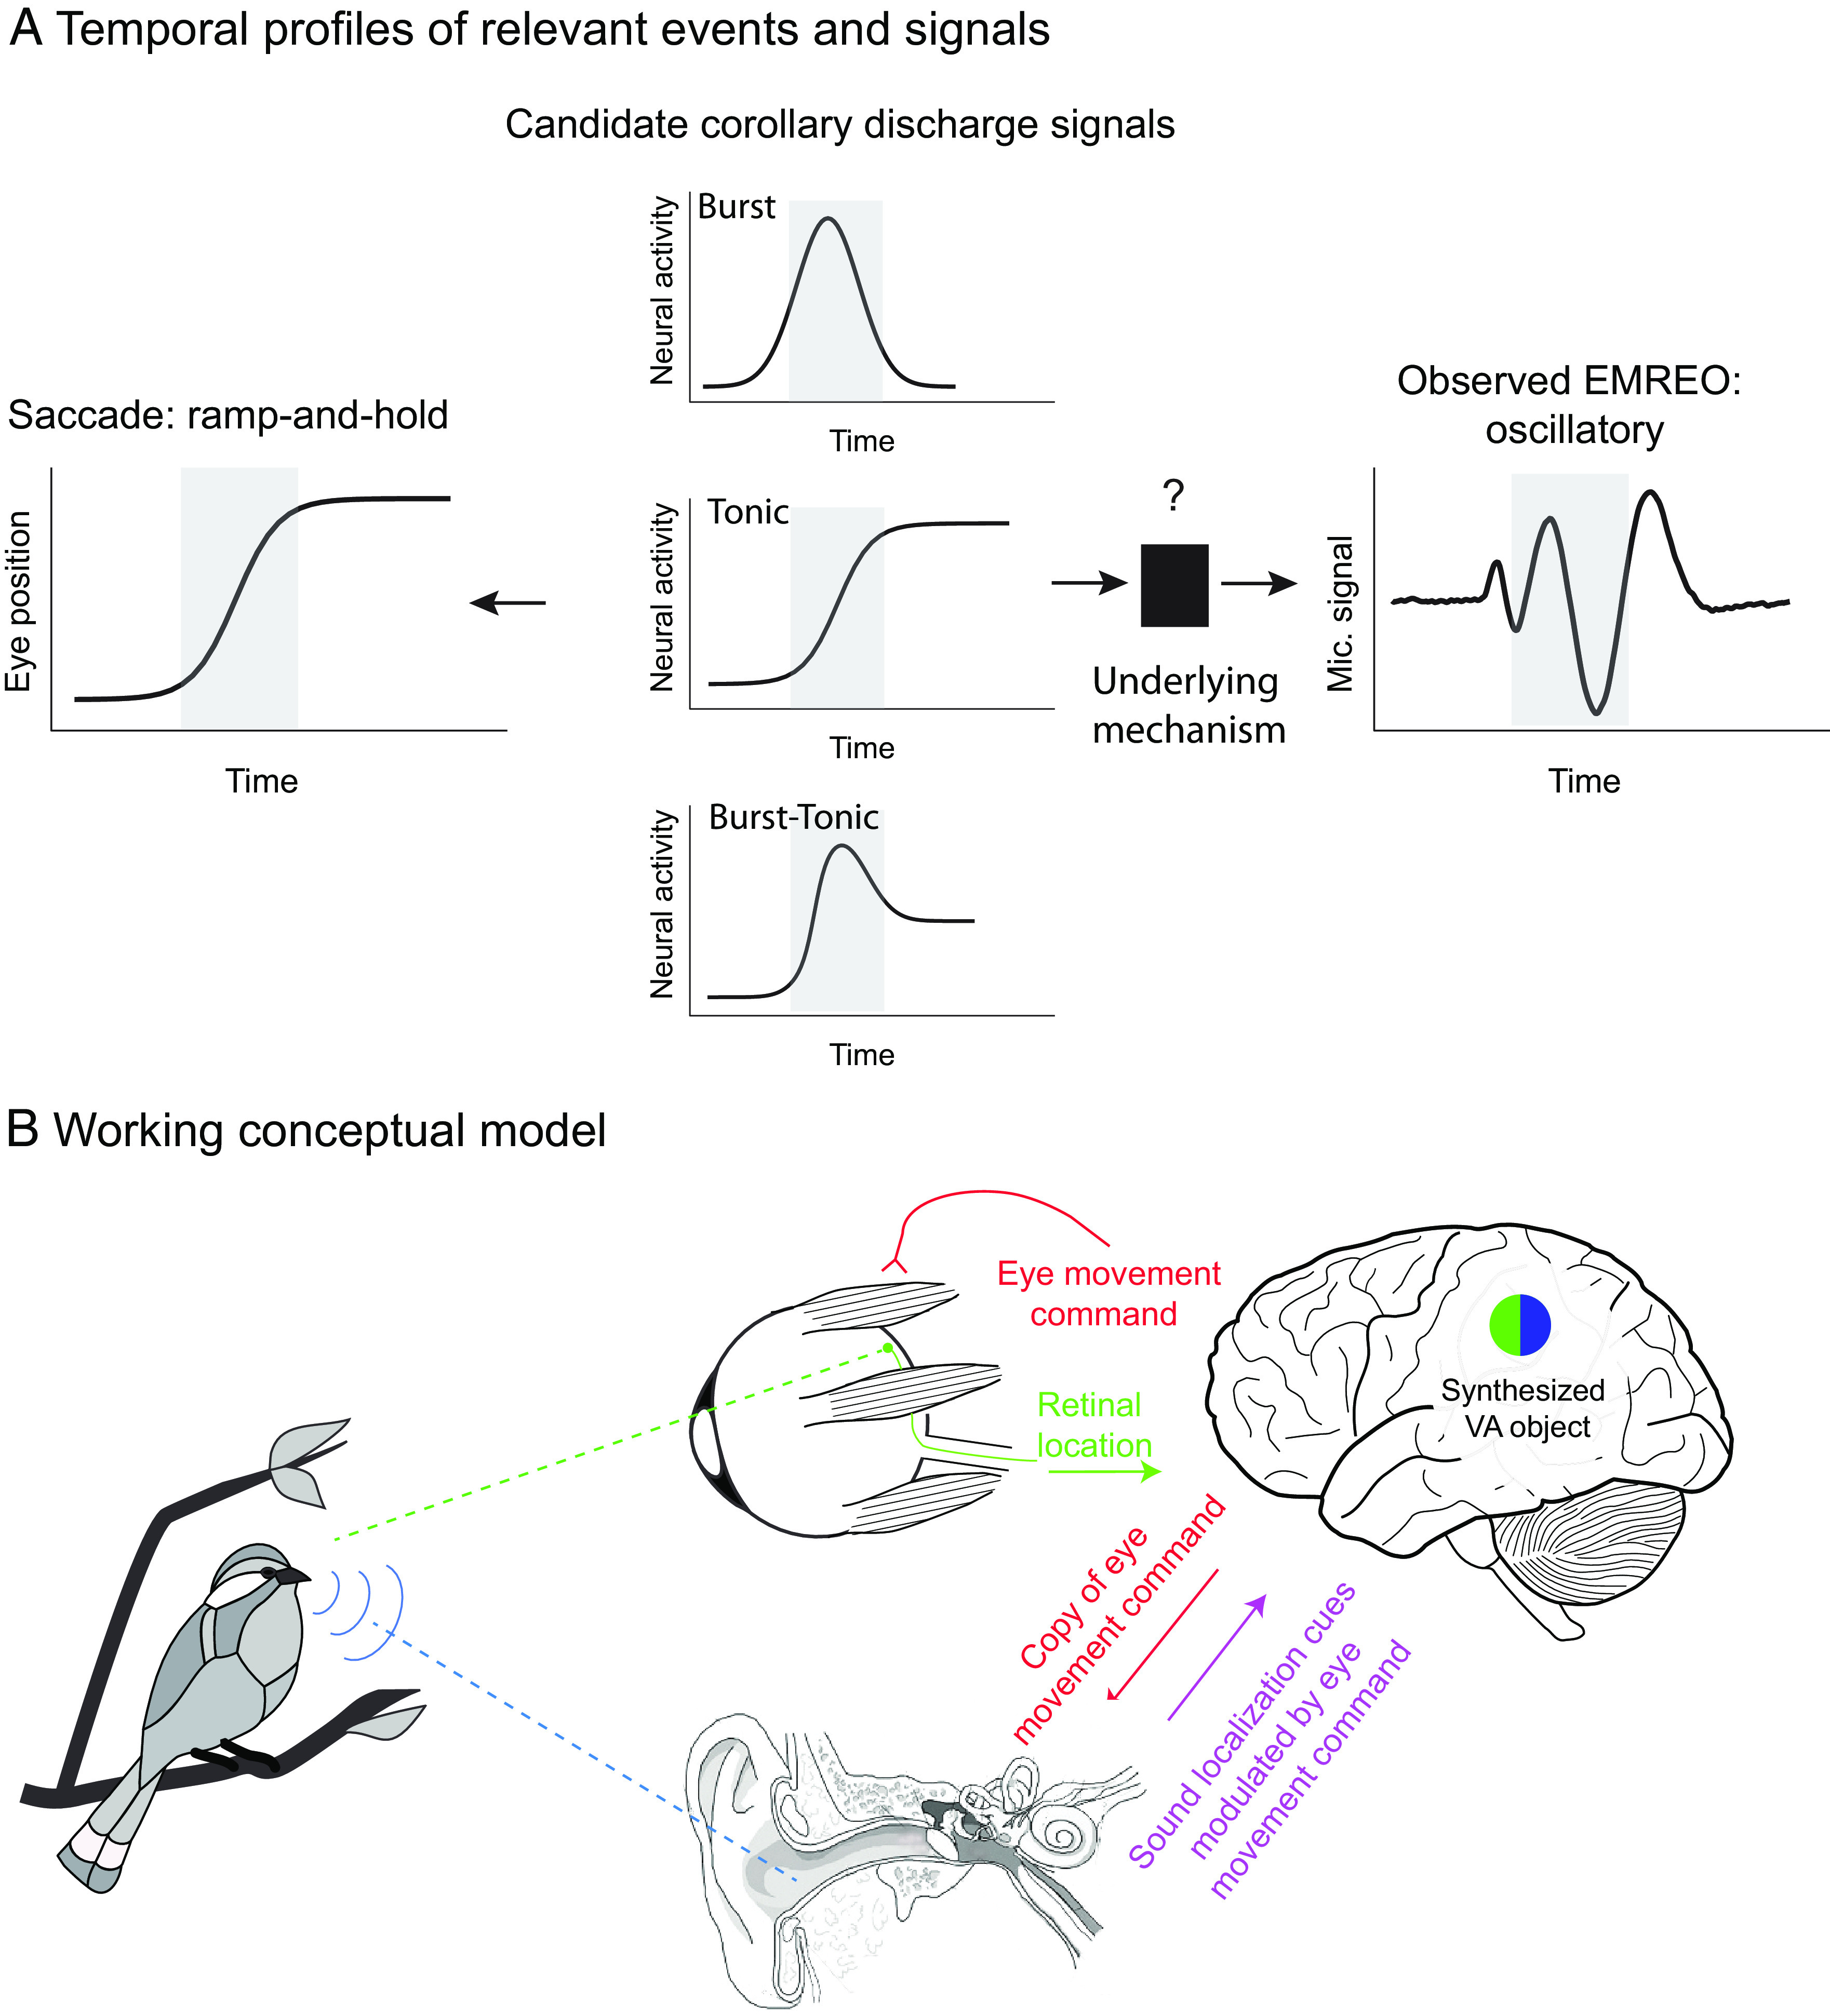
Temporal profiles of relevant signals and working conceptual model for how EMREOs might relate to our ability to link visual and auditory stimuli in space. (A) Temporal profiles of signals. The EMREO is oscillatory, whereas the eye movement to which it is synchronized involves a ramp-and-hold temporal profile. Candidate source neural signals in the brain might exhibit a ramp-and-hold (tonic) pattern, suggesting a ramp-and-hold-like underlying effect on an as-yet-unknown peripheral mechanism, or could derive from other known temporal profiles including bursts of activity time-locked to saccades. (B) Working conceptual model. The brain causes the eyes to move by sending a command to the eye muscles. Each eye movement shifts the location of visual stimuli on the retinal surface. A copy, possibly a highly transformed one, of this eye movement command is sent to the ear, altering ear mechanics in some unknown way. When a sound occurs, the ascending signal to the brain will depend on the combination of its location in head-centered space (based on the physical values of binaural timing and level differences and spectral cues) and aspects of recent eye movements and fixation position. This hybrid signal could then be readout by the brain.
Available eye movement control signals in the oculomotor system include those that follow this ramp-and-hold temporal profile or tonic activity that is proportional to eye position throughout periods of both movement and fixation. In addition to such tonic signals, oculomotor areas also contain neurons that exhibit burst patterns or elevated discharge in association with the saccade itself, as well as combinations of burst and tonic patterns (for reviews, see refs. 59 and 60). It remains to be seen which of these signals or signal combinations might be sent to the auditory periphery and where they might come from. The paramedian pontine reticular formation is a strong candidate for a source, having been implicated in providing corollary discharge signals of eye movements in visual experiments (61) (see also ref. 62) and containing each of these basic temporal signal profiles (59, 60). Regardless of the source and nature of the descending corollary discharge signal, the oscillations observed here should be thought of as possibly constituting a biomarker for an underlying, currently unknown, mechanism, rather than necessarily the effect itself.
Despite these critical unknowns, it is useful to articulate a working conceptual model of how EMREOs might facilitate visual and auditory integration (Fig. 7B). The general notion is that, by sending a copy of each eye movement command to the motor elements of the auditory periphery, the brain keeps the ear informed about the current orientation of the eyes. If, as noted above, these descending oculomotor signals cause a ramp-to-step change in the state of tension of components within the EMREO pathway, time-locked to the eye movement and lasting for the duration of each fixation period, they would effectively change the transduction mechanism in an eye position/eye movement–dependent fashion. In turn, these changes could affect the latency, gain, or frequency-filtering properties of the response to sound. Indeed, intriguing findings from Puria et al. (35) have recently indicated that the tension applied by the middle ear muscles likely affects all three of these aspects of sound transmission throughout the middle ear. In short, the signal sent to the brain in response to an incoming sound could ultimately reflect a mixture of the physical cues related to the location of the sound itself—the interaural timing differences, interaural level differences, and spectral cues—and eye position/movement information.
Most neurophysiological studies report signals consistent with a hybrid code in which information about sound location is blended in a complex fashion with information about eye position and movement, both within and across neurons (6, 10, 11, 18, 19, 21, 44). Computational modeling confirms that, in principle, these complex signals can be read out to produce a signal of sound location with respect to the eyes (10). However, substantive differences do remain between the observations here and such neural studies, chiefly in that the neural investigations have focused primarily on periods of steady fixation. A more complete characterization of neural signals time-locked to saccades is therefore needed (8, 63).
Note that this working model differs from a spatial attention mechanism in which the brain might direct the ears to “listen” selectively to a particular location in space. Rather, under our working model, the response to sounds from any location would be impacted by peripheral eye movement/position dependence in a consistent fashion across all sound locations. However, such a system could well work in concert with top–down attention, which has previously been shown to impact outer hair cells even when participants are required to fixate and not make eye movements (64–70).
Another question concerns whether EMREOs might actually impair sound localization, specifically for brief sounds presented during an eye movement. We think the answer to this is no. Boucher et al. (2) reported that perisaccadic sound localization is quite accurate, which suggests that EMREOs (or their underlying mechanism) do not impair perception. This is an important insight because given the rate at which eye movements occur—about 3/s—and with each associated EMREO signal lasting 100 ms or longer [due to extending past the end of saccades, as explored by Gruters et al. (25) and (28)], it would be highly problematic if sounds could not be accurately detected or localized when they occur in conjunction with saccades. If there is indeed a step-ramp system underlying the observed oscillations, then transduction of all sounds will be affected, regardless of when they occur with respect to saccades. Indeed, recent work supports the view that sound detection is unaffected by saccades (27).
All this being said, a role for EMREOs in computing the spatial location of sounds with respect to the visual scene does not preclude other roles. Specifically, they could also play a role in synchronizing sampling in the temporal domain (e.g., refs. 29–33). Such a possibility could account for the significant constant term C(t) of the regression analysis (Eq. 1 and Fig. 3). This temporally precise nonspatial component could play a role in resetting or refreshing of auditory processing across time or coordinating with the refreshing of the visual image on the retina.
Overall, how brain-controlled mechanisms adjust the signaling properties of peripheral sensory structures is critical for understanding sensory processing as a whole. Auditory signals are known to adjust the sensitivity of the visual system via sound-triggered pupil dilation (71), indicating that communication between these two senses is likely to be a two-way street. The functional impact of such communication at low-level stages is yet to be fully explored and may have implications for how individuals compensate when the information from one sensory system is inadequate, either due to natural situations such as noisy sound environments or occluded visual ones or due to physiological impairments in one or more sensory systems.
Supplementary Material
Appendix 01 (PDF)
Acknowledgments
We are grateful to Dr. Matthew Cooper, Dr. Kurtis Gruters, Jesse Herche, Dr. David Kaylie, Dr. Jeff Mohl, Dr. Shawn Willett, Meredith Schmehl, Dr. Jonathan Siegel, Chadbourne Smith, Dr. David Smith, Justine Shih, Chloe Weiser, and Tingan Zhu for discussions and other assistance concerning this project. This work was supported by NIH (National Institute on Deafness and Other Communication Disorders) grant DC017532 to J.M.G.
Author contributions
S.N.L., C.D.K., D.L.K.M., and J.M.G. designed research; S.N.L., C.D.K., R.E.L., and J.M.G. performed research; S.N.L., C.D.K., D.L.K.M., C.A.S., and J.M.G. contributed new reagents/analytic tools; S.N.L., C.D.K., D.L.K.M., and J.M.G. analyzed data; and S.N.L., C.D.K., D.L.K.M., and J.M.G. wrote the paper.
Competing interests
The authors declare no competing interest.
Footnotes
This article is a PNAS Direct Submission.
*We note that EMREOs are unlikely to be due to the actual sound of the eyes moving in the orbits. Our original study, Gruters et al. (25) showed that when microphone recordings are aligned on saccade offset (as opposed to onset, as we did here), EMREOs continue for at least several 10’s of ms after the eyes have stopped moving.
Contributor Information
Stephanie N. Lovich, Email: stephanie.schlebusch@duke.edu.
Jennifer M. Groh, Email: jmgroh@duke.edu.
Data, Materials, and Software Availability
Anonymized microphone recordings, eye movements and associated parameters data have been deposited in the Figshare+ repository (72).
Supporting Information
References
- 1.Groh J. M., Sparks D. L., Two models for transforming auditory signals from head-centered to eye- centered coordinates. Biol. Cybernetics 67, 291–302 (1992). [DOI] [PubMed] [Google Scholar]
- 2.Boucher L., Groh J. M., Hughes H. C., Afferent delays and the mislocalization of perisaccadic stimuli. Vis. Res. 41, 2631–2644 (2001). [DOI] [PubMed] [Google Scholar]
- 3.Metzger R. R., Mullette-Gillman O. A., Underhill A. M., Cohen Y. E., Groh J. M., Auditory saccades from different eye positions in the monkey: Implications for coordinate transformations. J. Neurophysiol. 92, 2622–2627 (2004). [DOI] [PubMed] [Google Scholar]
- 4.Caruso V. C., Pages D. S., Sommer M. A., Groh J. M., Compensating for a shifting world: Evolving reference frames of visual and auditory signals across three multimodal brain areas. J. Neurophysiol. 126, 82–94 (2021). [DOI] [PMC free article] [PubMed] [Google Scholar]
- 5.Fu K. M., et al. , Timing and laminar profile of eye-position effects on auditory responses in primate auditory cortex. J. Neurophysiol. 92, 3522–3531 (2004). [DOI] [PubMed] [Google Scholar]
- 6.Maier J. X., Groh J. M., Comparison of gain-like properties of eye position signals in inferior colliculus versus auditory cortex of primates. Front. Integr. Neurosci. 4, 121–132 (2010). [DOI] [PMC free article] [PubMed] [Google Scholar]
- 7.Werner-Reiss U., Kelly K. A., Trause A. S., Underhill A. M., Groh J. M., Eye position affects activity in primary auditory cortex of primates. Curr. Biol. 13, 554–562 (2003). [DOI] [PubMed] [Google Scholar]
- 8.Bulkin D. A., Groh J. M., Distribution of eye position information in the monkey inferior colliculus. J. Neurophysiol. 107, 785–795 (2012). [DOI] [PMC free article] [PubMed] [Google Scholar]
- 9.Bulkin D. A., Groh J. M., Distribution of visual and saccade related information in the monkey inferior colliculus. Front. Neural Circuits 6, 61 (2012). [DOI] [PMC free article] [PubMed] [Google Scholar]
- 10.Groh J. M., Trause A. S., Underhill A. M., Clark K. R., Inati S., Eye position influences auditory responses in primate inferior colliculus. Neuron 29, 509–518 (2001). [DOI] [PubMed] [Google Scholar]
- 11.Porter K. K., Metzger R. R., Groh J. M., Representation of eye position in primate inferior colliculus. J. Neurophysiol. 95, 1826–1842 (2006). [DOI] [PubMed] [Google Scholar]
- 12.Zwiers M. P., Versnel H., Van Opstal A. J., Involvement of monkey inferior colliculus in spatial hearing. J. Neurosci. 24, 4145–4156 (2004). [DOI] [PMC free article] [PubMed] [Google Scholar]
- 13.Russo G. S., Bruce C. J., Frontal eye field activity preceding aurally guided saccades. J. Neurophysiol. 71, 1250–1253 (1994). [DOI] [PubMed] [Google Scholar]
- 14.Mullette-Gillman O. A., Cohen Y. E., Groh J. M., Motor-related signals in the intraparietal cortex encode locations in a hybrid, rather than eye-centered, reference frame. Cerebral. Cortex. 19, 1761–1775 (2009). [DOI] [PMC free article] [PubMed] [Google Scholar]
- 15.Mullette-Gillman O. A., Cohen Y. E., Groh J. M., Eye-centered, head-centered, and complex coding of visual and auditory targets in the intraparietal sulcus. J. Neurophysiol. 94, 2331–2352 (2005). [DOI] [PubMed] [Google Scholar]
- 16.Cohen Y. E., Andersen R. A., Reaches to sounds encoded in an eye-centered reference frame. Neuron 27, 647–652 (2000). [DOI] [PubMed] [Google Scholar]
- 17.Stricanne B., Andersen R. A., Mazzoni P., Eye-centered, head-centered, and intermediate coding of remembered sound locations in area LIP. J. Neurophysiol. 76, 2071–2076 (1996). [DOI] [PubMed] [Google Scholar]
- 18.Lee J., Groh J. M., Auditory signals evolve from hybrid- to eye-centered coordinates in the primate superior colliculus. J. Neurophysiol. 108, 227–242 (2012). [DOI] [PMC free article] [PubMed] [Google Scholar]
- 19.Jay M. F., Sparks D. L., Auditory receptive fields in primate superior colliculus shift with changes in eye position. Nature 309, 345–347 (1984). [DOI] [PubMed] [Google Scholar]
- 20.Jay M. F., Sparks D. L., Sensorimotor integration in the primate superior colliculus. I. Motor convergence. J. Neurophysiol. 57, 22–34 (1987). [DOI] [PubMed] [Google Scholar]
- 21.Jay M. F., Sparks D. L., Sensorimotor integration in the primate superior colliculus. II. Coordinates of auditory signals. J. Neurophysiol. 57, 35–55 (1987). [DOI] [PubMed] [Google Scholar]
- 22.Zella J. C., Brugge J. F., Schnupp J. W., Passive eye displacement alters auditory spatial receptive fields of cat superior colliculus neurons. Nat. Neurosci. 4, 1167–1169 (2001). [DOI] [PubMed] [Google Scholar]
- 23.Populin L. C., Tollin D. J., Yin T. C., Effect of eye position on saccades and neuronal responses to acoustic stimuli in the superior colliculus of the behaving cat. J. Neurophysiol. 92, 2151–2167 (2004). [DOI] [PubMed] [Google Scholar]
- 24.Hartline P. H., Vimal R. L., King A. J., Kurylo D. D., Northmore D. P., Effects of eye position on auditory localization and neural representation of space in superior colliculus of cats. Exp. Brain Res. 104, 402–408 (1995). [DOI] [PubMed] [Google Scholar]
- 25.Gruters K. G., et al. , The eardrums move when the eyes move: A multisensory effect on the mechanics of hearing. Proc. Natl. Acad. Sci. U.S.A. 115, E1309–E1318 (2018). [DOI] [PMC free article] [PubMed] [Google Scholar]
- 26.Lovich S. N., et al. , Conserved features of eye movement related eardrum oscillations (EMREOs) across humans and monkeys. Philos. Trans. R. Soc. Lond. Series B Biol. Sci. 378, 20220340 (2023). [DOI] [PMC free article] [PubMed] [Google Scholar]
- 27.Bröhl F., Kayser C., Detection of spatially-localized sounds is robust to saccades and concurrent eye movement-related eardrum oscillations (EMREOs). J. Neurosci., in press. [DOI] [PMC free article] [PubMed] [Google Scholar]
- 28.King C. D., et al. , Individual similarities and differences in eye-movement-related eardrum oscillations (EMREOs). Hear. Res., in press. [DOI] [PMC free article] [PubMed]
- 29.O’Connell M. N., et al. , The role of motor and environmental visual rhythms in structuring auditory cortical excitability. iScience 23, 101374 (2020). [DOI] [PMC free article] [PubMed] [Google Scholar]
- 30.Barczak A., et al. , Dynamic modulation of cortical excitability during visual active sensing. Cell Rep. 27, 3447–3459.e3 (2019). [DOI] [PMC free article] [PubMed] [Google Scholar]
- 31.Köhler M. H. A., Weisz N., Cochlear theta activity oscillates in phase opposition during interaural attention. J. Cogn. Neurosci. 35, 588–602 (2023). [DOI] [PubMed] [Google Scholar]
- 32.Leszczynski M., et al. , Saccadic modulation of neural excitability in auditory areas of the neocortex. Curr. Biol. 33, 1185–1195.e6 (2023). [DOI] [PMC free article] [PubMed] [Google Scholar]
- 33.Köhler M. H. A., Demarchi G., Weisz N., Cochlear activity in silent cue-target intervals shows a theta-rhythmic pattern and is correlated to attentional alpha and theta modulations. BMC Biol. 19, 48 (2021). [DOI] [PMC free article] [PubMed] [Google Scholar]
- 34.Gallagher L., Diop M., Olson E. S., Time-domain and frequency-domain effects of tensor tympani contraction on middle ear sound transmission in gerbil. Hear Res. 405, 108231 (2021). [DOI] [PMC free article] [PubMed] [Google Scholar]
- 35.Cho N. H., Ravicz M. E., Puria S., Human middle-ear muscle pulls change tympanic-membrane shape and low-frequency middle-ear transmission magnitudes and delays. Hear Res. 430, 108721 (2023). [DOI] [PubMed] [Google Scholar]
- 36.Monti M. M., Statistical analysis of fMRI time-series: A critical review of the GLM approach. Front. Hum. Neurosci. 5, 28 (2011). [DOI] [PMC free article] [PubMed] [Google Scholar]
- 37.Middlebrooks J. C., Green D. M., Sound localization by human listeners. Annu. Rev. Psychol. 42, 135–159 (1991). [DOI] [PubMed] [Google Scholar]
- 38.Hebrank J., Wright D., Are two ears necessary for localization of sound sources on the median plane? J. Acoust. Soc. Am. 56, 935–938 (1974). [DOI] [PubMed] [Google Scholar]
- 39.Hebrank J., Wright D., Spectral cues used in the localization of sound sources on the median plane. J. Acoust. Soc. Am. 56, 1829–1834 (1974). [DOI] [PubMed] [Google Scholar]
- 40.Macpherson E. A., Sabin A. T., Vertical-plane sound localization with distorted spectral cues. Hear Res. 306, 76–92 (2013). [DOI] [PMC free article] [PubMed] [Google Scholar]
- 41.Blauert J., Spatial Hearing (MIT Press, Cambridge, MA, 1997). [Google Scholar]
- 42.Groh J. M., Making Space: How the Brain Knows Where Things Are (Harvard University Press, Cambridge, MA, 2014). [Google Scholar]
- 43.Ege R., Opstal A. J. V., Van Wanrooij M. M., Accuracy-precision trade-off in human sound localisation. Sci. Rep. 8, 16399 (2018). [DOI] [PMC free article] [PubMed] [Google Scholar]
- 44.Caruso V. C., Pages D. S., Sommer M. A., Groh J. M., Compensating for a shifting world: A quantitative comparison of the reference frame of visual and auditory signals across three multimodal brain areas. J Neurophysiol. 126, 82–94 (2021). [DOI] [PMC free article] [PubMed] [Google Scholar]
- 45.Abbasi H., et al. , Audiovisual temporal recalibration modulates eye movement-related eardrum oscillations. International Multisensory Research Forum Brussels, Belgium, 27–30 June 2023. Abstract 37. https://imrf2023.sciencesconf.org/data/pages/IMRF23_FullProgram.pdf.
- 46.Hung I. J., Dallos P., Study of the acoustic reflex in human beings. I. Dynamic characteristics. J. Acoust. Soc. Am. 52, 1168–1180 (1972). [DOI] [PubMed] [Google Scholar]
- 47.Mendelson E. S., A sensitive method for registration of human intratympanic muscle reflexes. J. Appl. Physiol. 11, 499–502 (1957). [DOI] [PubMed] [Google Scholar]
- 48.Gelfand S. A., “The contralateral acoustic reflex” in The Acoustic Reflex: Basic Principles and Clinical Applications, Silman S., Dirks D. D., Eds. (Academic Press, New York, NY, 1984), pp. 137–186. [Google Scholar]
- 49.Brownell W. E., Bader C. R., Bertrand D., de Ribaupierre Y., Evoked mechanical responses of isolated cochlear outer hair cells. Science 227, 194–196 (1985). [DOI] [PubMed] [Google Scholar]
- 50.Guinan J. J. Jr., “Cochlear mechanics, otacoustic emisssions, and medial olivocochlear efferents: Twenty years of advances and controversies along with areas ripe for new work” in Perspectives on Auditory Research, (Springer, New York, 2014), pp. 229–246. [Google Scholar]
- 51.Guinan J. J. Jr., Olivocochlear efferents: Anatomy, physiology, function, and the measurement of efferent effects in humans. Ear Hear. 27, 589–607 (2006). [DOI] [PubMed] [Google Scholar]
- 52.Mukerji S., Windsor A. M., Lee D. J., Auditory brainstem circuits that mediate the middle ear muscle reflex. Trends Amplif. 14, 170–191 (2010). [DOI] [PMC free article] [PubMed] [Google Scholar]
- 53.Cooper N. P., Guinan J. J. Jr., Efferent-mediated control of basilar membrane motion. J. Physiol. 576, 49–54 (2006). [DOI] [PMC free article] [PubMed] [Google Scholar]
- 54.Liberman M. C., Guinan J. J. Jr., Feedback control of the auditory periphery: Anti-masking effects of middle ear muscles vs. olivocochlear efferents. J. Commun. Disord. 31, 471–482; quiz 483; 553 (1998). [DOI] [PubMed] [Google Scholar]
- 55.Galambos R., Suppression of auditory nerve activity by stimulation of efferent fibers to cochlea. J Neurophysiol. 19, 424–437 (1956). [DOI] [PubMed] [Google Scholar]
- 56.Schlebusch S. N., et al. , Changes in saccade-related eardrum oscillations after surgical denervation of the stapedius muscle. Soc. Neurosci. Abstr. 578 (2019). [Google Scholar]
- 57.Schlebusch S. N., et al. , Changes in saccade-related eardrum oscillations after surgical denervation of the stapedius muscle. Assoc. Res. Otolaryngol. Abstr. PD89 (2020). [Google Scholar]
- 58.King C., Lovich S., Kaylie D., Shera C., Groh J., Measuring the impact of auditory system impairments on eye-movement-related eardrum oscillations (EMREOs). Assoc. Res. Otolaryngol. Abstr. Orlando, FL, February 2023 TU177 (2023). [Google Scholar]
- 59.Takahashi M., Shinoda Y., Brain stem neural circuits of horizontal and vertical saccade systems and their frame of reference. Neuroscience 392, 281–328 (2018). [DOI] [PubMed] [Google Scholar]
- 60.Fuchs A. F., Kaneko C. R., Scudder C. A., Brainstem control of saccadic eye movements. Annu. Rev. Neurosci. 8, 307–337 (1985). [DOI] [PubMed] [Google Scholar]
- 61.Sparks D. L., Mays L. E., Porter J. D., Eye movements induced by pontine stimulation: Interaction with visually triggered saccades. J. Neurophysiol. 58, 300–318 (1987). [DOI] [PubMed] [Google Scholar]
- 62.Guthrie B. L., Porter J. D., Sparks D. L., Corollary discharge provides accurate eye position information to the oculomotor system. Science 221, 1193–1195 (1983). [DOI] [PubMed] [Google Scholar]
- 63.Porter K. K., Metzger R. R., Groh J. M., Visual- and saccade-related signals in the primate inferior colliculus. Proc. Natl. Acad. Sci. U.S.A. 104, 17855–17860 (2007). [DOI] [PMC free article] [PubMed] [Google Scholar]
- 64.Delano P. H., Elgueda D., Hamame C. M., Robles L., Selective attention to visual stimuli reduces cochlear sensitivity in chinchillas. J. Neurosci. 27, 4146–4153 (2007). [DOI] [PMC free article] [PubMed] [Google Scholar]
- 65.Harkrider A. W., Bowers C. D., Evidence for a cortically mediated release from inhibition in the human cochlea. J. Am. Acad. Audiol. 20, 208–215 (2009). [DOI] [PubMed] [Google Scholar]
- 66.Srinivasan S., Keil A., Stratis K., Woodruff Carr K. L., Smith D. W., Effects of cross-modal selective attention on the sensory periphery: Cochlear sensitivity is altered by selective attention. Neuroscience 223, 325–332 (2012). [DOI] [PMC free article] [PubMed] [Google Scholar]
- 67.Srinivasan S., et al. , Interaural attention modulates outer hair cell function. Eur. J. Neurosci. 40, 3785–3792 (2014). [DOI] [PMC free article] [PubMed] [Google Scholar]
- 68.Walsh K. P., Pasanen E. G., McFadden D., Selective attention reduces physiological noise in the external ear canals of humans. I: Auditory attention. Hear Res. 312, 143–159 (2014). [DOI] [PMC free article] [PubMed] [Google Scholar]
- 69.Walsh K. P., Pasanen E. G., McFadden D., Changes in otoacoustic emissions during selective auditory and visual attention. J. Acoust. Soc. Am. 137, 2737–2757 (2015). [DOI] [PMC free article] [PubMed] [Google Scholar]
- 70.Wittekindt A., Kaiser J., Abel C., Attentional modulation of the inner ear: A combined otoacoustic emission and EEG study. J. Neurosci. 34, 9995–10002 (2014). [DOI] [PMC free article] [PubMed] [Google Scholar]
- 71.Bala A. D., Takahashi T. T., Pupillary dilation response as an indicator of auditory discrimination in the barn owl. J. Comp. Physiol. A 186, 425–434 (2000). [DOI] [PubMed] [Google Scholar]
- 72.Groh J. M., Murphy D. L. K., Lovich S. N., King C. D., Eye movement-related eardrum oscillations (EMREOs) dataset and supporting code. Figshare+. 10.25452/figshare.plus.24470548. Deposited 1 November 2023. [DOI]
Associated Data
This section collects any data citations, data availability statements, or supplementary materials included in this article.
Supplementary Materials
Appendix 01 (PDF)
Data Availability Statement
Anonymized microphone recordings, eye movements and associated parameters data have been deposited in the Figshare+ repository (72).