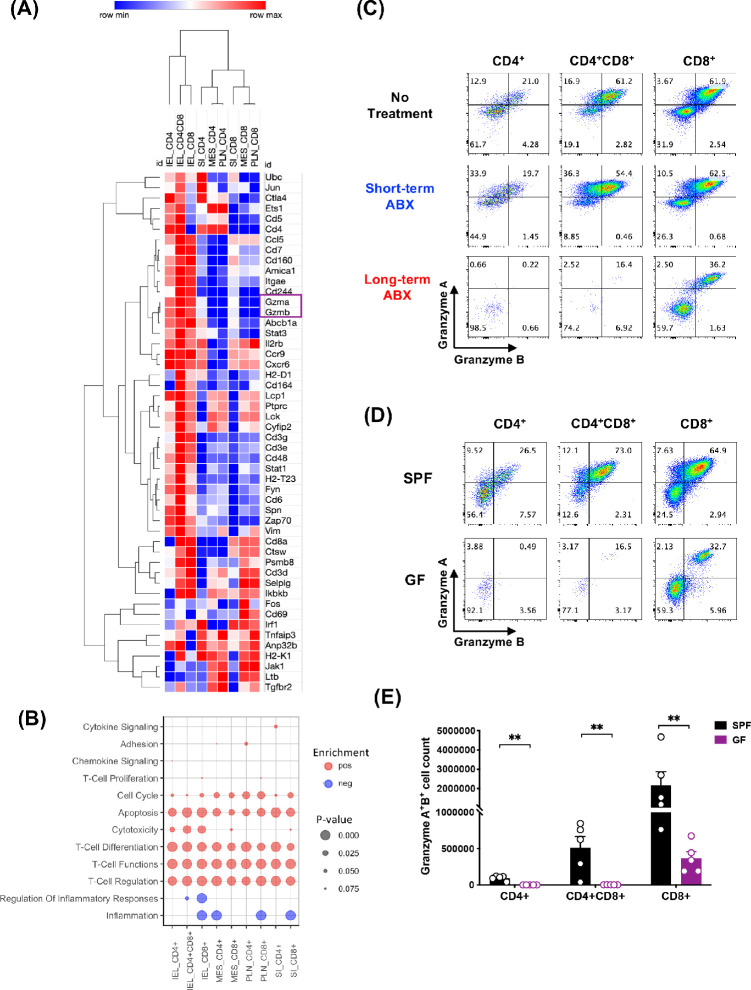
Figure 5.
IELs expressed high levels of granzymes A and B, dependent on microbiota. CD4+, CD4+CD8a+ (DP), and CD8a+CD90+ cells from peripheral lymph nodes (PLN) and mesenteric lymph nodes (MES), small intestine lamina propria (SI), and IEL compartments were FACS sorted from naïve B10.RIII mice, and their gene expression was analyzed by NanoString. (A) Heatmap clustering of the top 50 genes generated by Morpheus. (B) GSEA of the pre-ranked transcriptome using custom annotated gene sets based on the nSolver immune response categories. Positive gene set enrichments are shown as red dots (pos). Negative enrichments are shown as blue dots (neg). The size of the dots represents the P value significance of the gene set enrichments. (C) Representative flow plots of granzyme-producing IELs on day 7 of EAU. (D) Representative flow plots of granzyme-producing IELs in SPF and GF mice from three independent experiments. (E) Counts of granzyme A– and granzyme B–producing IELs from SPF and GF mice. **P < 0.01.

