Figure 2.
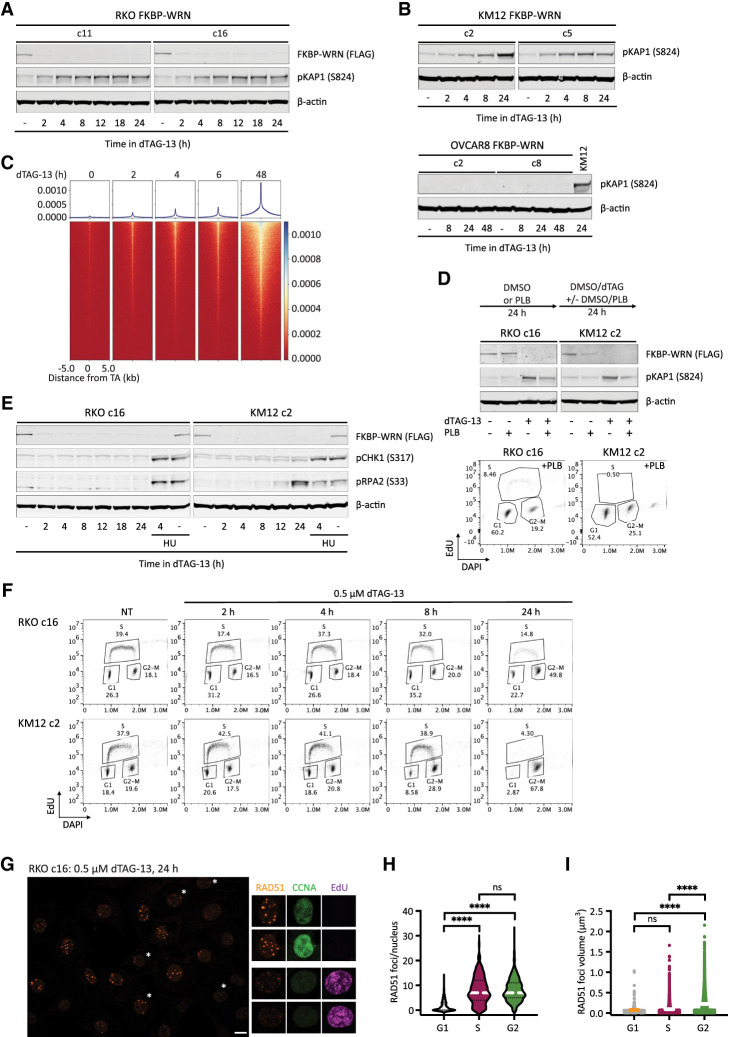
Acute degradation of WRN in MSI-H cancer cells causes replication-associated DNA damage without accompanying intra-S checkpoint activation. (A,B) Immunoblotting depicting the rapid induction of pKAP1, a marker of DNA double-strand breaks, by 0.5 μM dTAG-13 in RKO (A) and KM12 (B) clones expressing FKBP-WRN. In contrast, dTAG-13 did not induce pKAP1 in OVCAR8 clones expressing FKBP-WRN even after extended treatment. One of two independent experiments is shown. (C) END-seq showing the rapid appearance of DNA breakage at unstable expanded TA repeats in KM12 cells treated with 0.5 μM dTAG-13. (D, top panel) Immunoblotting showing that 0.5 μM dTAG-13 (24 h) induced significantly lower levels of pKAP1 in RKO and KM12 cells pretreated for 24 h with 5 μM palbociclib (PLB). (Bottom panel) Successful inhibition of S-phase entry by PLB was confirmed by FACS-based cell cycle analyses. One of three independent experiments is shown. (E) Immunoblotting demonstrating the lack of CHK1 (S317) and RPA2 (S33) phosphorylation in dTAG-treated RKO FKBP-WRN cells. CHK1/RPA2 phosphorylation was also undetectable in KM12 FKBP-WRN cells except at 24 h after dTAG-13 treatment. Where indicated, cells were treated with 3 mM hydroxyurea (HU) for 2 h, either alone or in combination with 0.5 μM dTAG-13 (2 h of dTAG-13 pretreatment followed by 2 h of HU + dTAG-13). Note that HU induced robust CHK1/RPA phosphorylation in both RKO and KM12 independently of WRN. One of two independent experiments is shown. (F) FACS-based cell cycle analyses showing that dTAG-treated RKO and KM12 cells failed to slow down or halt DNA synthesis during the first S phase after acute WRN degradation. Note that WRN-degraded cells eventually completed S phase and activated the G2 checkpoint. (G) Representative confocal images depicting RAD51 foci (maximum intensity projection) in RKO FKBP-WRN cells treated or not with 0.5 μM dTAG-13 for 24 h. Cyclin A (CCNA) and EdU positivity was used to distinguish cells in S phase from those in G2. Note that RAD51 foci appear to be larger in G2 cells (EdU-negative, CCNA-high), as compared with S-phase cells (EdU-positive, CCNA-low/intermediate). (H) Quantification of RAD51 number per nucleus as a function of cell cycle position. (I) Volumetric analysis of RAD51 foci as a function of cell cycle position. One of two independent experiments is shown.

