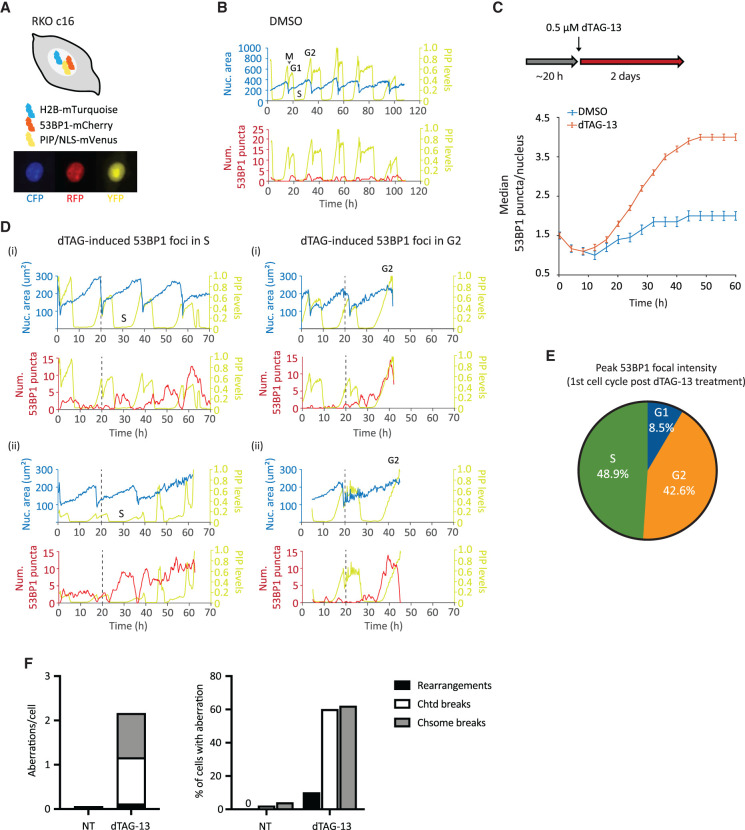
Figure 3.
Induction and repair of DNA damage in WRN-degraded MSI-H cancer cells monitored by time-lapse microscopy. (A) Schematics of the RKO triple-reporter line used for live-cell imaging. An example of vehicle-treated cells is shown below in the CFP, RFP, and YFP channels. (B) Automated cell tracking was performed as described in the Materials and Methods. Example traces of a vehicle-treated reporter cell over time; different phases of the cell cycle are indicated. The birth of a cell at mitosis (M) coincides with a reduction in nuclear area (as defined by H2B-mTurquoise) as well as PIP sensor intensity. PIP intensity increases in G1 but is then abruptly lost as a cell enters S phase. Finally, PIP expression returns in G2. 53BP1 focus formation is also shown for this vehicle-treated cell. (C) Formation of 53BP1 puncta as a function of time. Cells were first imaged for ∼20 h without drug to establish baseline 53BP1 levels. Subsequent addition of dTAG-13 resulted in a rapid induction of 53BP1 puncta over the baseline, which steadily increased over time. One of two independent experiments is shown. (D) Example traces of four dTAG-treated reporter cells. The two cells in the left panels showed induction of 53BP1 puncta during the first S phase after WRN degradation. The two cells in the right panels had primarily induced 53BP1 in the first G2 after WRN degradation. Note, however, that these two cells also displayed a smaller induction of 53BP1 in the preceding S phase. (E) Quantification of 53BP1 punctum intensity during the first cell cycle following acute WRN degradation revealed that peak 53BP1 induction occur predominantly in S and G2. One of two independent experiments is shown. (F) Analyses of metaphase spreads showing that a majority of dTAG-treated RKO cells failed to completely repair DNA breaks incurred in S/G2 and carried residual damages into the first mitosis. One of two independent experiments is shown.

