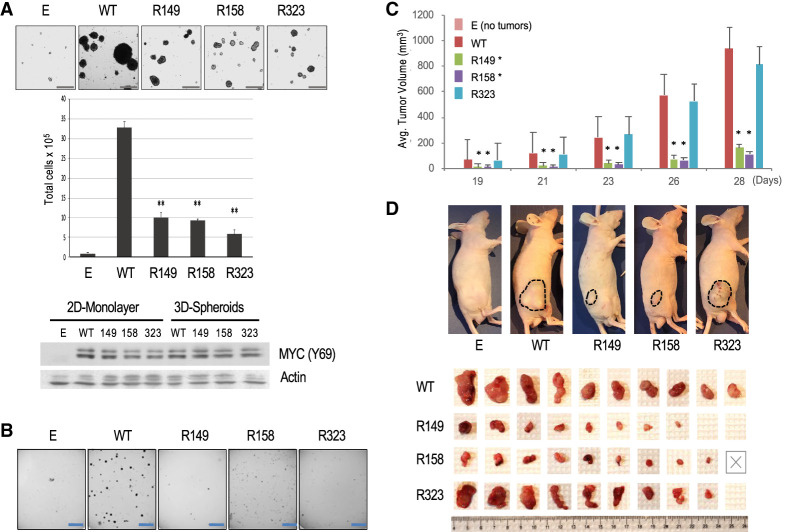
Figure 4.
Analysis of malignant transformation of Rat1a fibroblasts overexpressing MYC WT or individual K-to-R mutants. (A) Spontaneous spheroid formation assay with the indicated Rat1a cell lines. (Top) Microscopic images of spheroids. Scale bar, 250 μm. (Middle) Total cell counts after spheroid trypsinization. (Bottom) Western blot with equal amounts of WCE protein from cell lines grown as two-dimensional (2D) monolayers or 3D spheroids (with MYC Y69 and β-actin antibodies). (B) Representative images of soft agar colony formation assays with the indicated Rat1a cell lines. Scale bar, 5 mm. (C,D) Xenograft assays in nude mice injected with the indicated Rat1a cell lines. (C) Volume of tumors at different times after injection. (D) Images of tumors in mice before and after surgical excision (Rat1a-E cells did not generate tumors). The “X” indicates a mouse that died early.

