Figure 5.
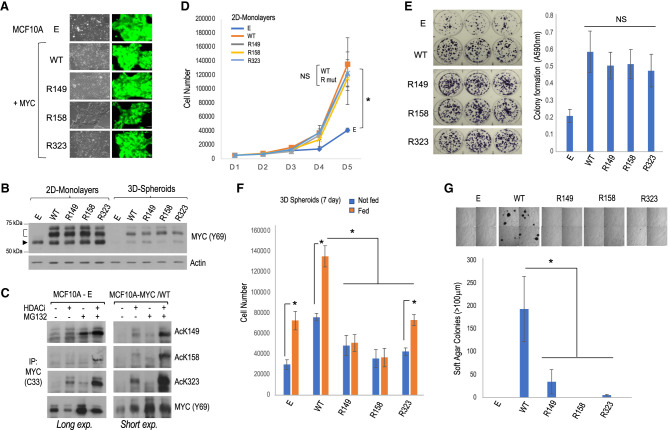
Analysis of malignant transformation of human MCF10A mammary epithelial cells overexpressing MYC WT or individual K-to-R mutants. (A) Phase contrast and GFP fluorescent images of the cell lines. (B) Western blot analysis of MYC expression levels for cell lines grown as monolayers and as spheroids. The arrowhead indicates endogenous MYC, and the bracket indicates ectopic FLAG-tagged MYC. (C) Analysis of MYC acetylation by IP and Western blot with the indicated antibodies in control (MCF10A-E) and MYC WT transformed (MCF10A-MYC/WT) cell lines; long and short exposures, respectively, are shown. (D) Proliferation of the different cell lines over a 5-d period in regular adherent culture plates. (E) Colony formation assays on regular adherent culture plates and quantitation of crystal violet staining. (NS) No significant difference between MYC WT and the R mutant cell lines. (F) Spheroid growth assays. Total number of cells at the end of the 7-d growth period without (blue bars) or with (orange bars) fresh growth medium feeding is indicated. (G) Soft agar colony formation assays. (Top) Representative microscopic images of four quadrants of each plate are shown. Scale bar, 250 μm. (Bottom) Plot showing the number of colonies ≥100 μm.

