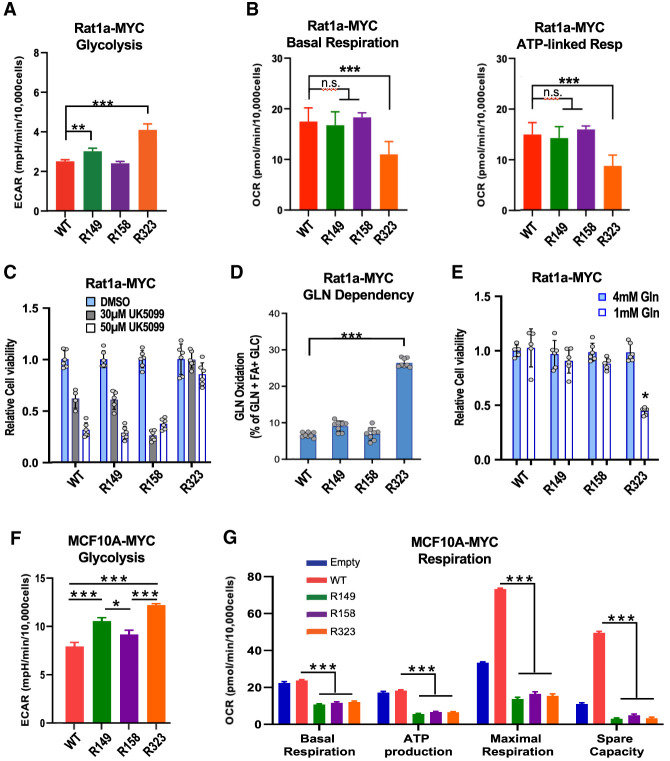
Figure 6.
Metabolic analyses of Rat1a and MCF10A cell lines overexpressing MYC WT or individual K-to-R mutants. (A,B) Rat1a cell line ECAR and OCR Seahorse analyses, respectively. (n.s.) Nonsignificant statistical difference (n = 5). (C) Cell viability measured by acid phosphatase assay after treatment with the mitochondrial pyruvate carrier inhibitor UK5099 for 72 h (n = 6). (D) Fraction of cellular OCR derived from glutamine oxidation (n = 8). (E) Viability of the cell lines (normalized to MYC WT cells) cultured for 72 h in medium with the indicated glutamine concentrations (n = 6). (F,G) MCF10A cell line ECAR and OCR Seahorse analyses, respectively, as above. The data (n = 5–8) were plotted as the means ± SD (A–E) or means ± SEM (F,G).

