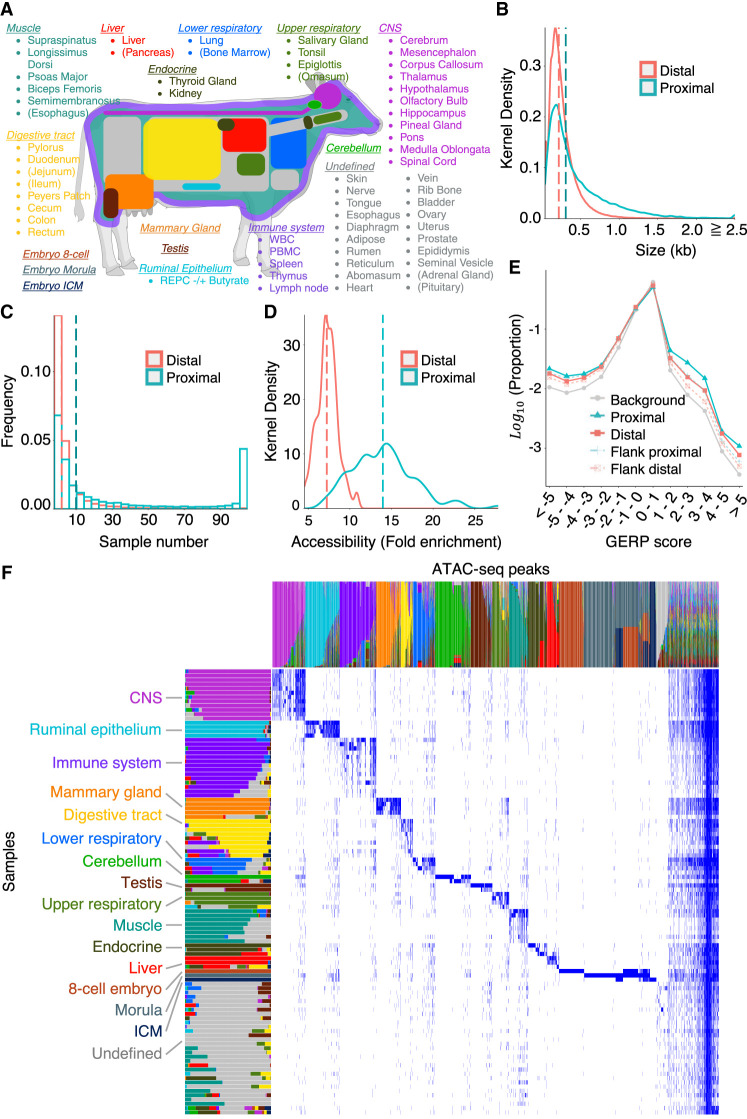
Figure 1.
Generation of an organism-wide catalog of cis-acting regulatory elements for the bovine. (A) Sixty-three tissue types with ATAC-seq data analyzed in this work. Novel ATAC-seq data were generated for 58 tissue types (89 samples), and public ATAC-seq data were downloaded for five (15 samples). Tissue types are grouped and colored based on the nonnegative matrix factorization (NMF) analysis described in D. Tissues are parenthesized when the largest NMF component in the tissue explains <50% of the total weight. This figure was created with BioRender (https://www.biorender.com). (B) Size distribution of proximal (green) and distal (red) ATAC-seq peaks (consensus peaks). (C) Distribution of the number of samples in which proximal (green) and distal (red) ATAC-seq peaks are open. (D) Distribution of the accessibility (fold-increase in coverage over background) of proximal (green) and distal (red) ATAC-seq peaks. The vertical dotted lines in B, C, and D correspond to the medians. (E) Distribution of GERP scores for nucleotide positions within proximal (solid green) and distal (solid red) ATAC-seq peaks, within sequence segments of same size immediately flanking proximal (dotted green) and distal (dotted red) ATAC-seq peaks, and across the entire genome (gray). The proportion of nucleotide positions without GERP score is not shown. (F) Decomposition of the 976,813-peak × 104-sample matrix in 16 components by nonnegative matrix factorization (NMF) following the method of Meuleman et al. (2020). As a result, each peak and each tissue sample are represented as a linear combination of the 16 components, which are color-coded in the graph. The lengths/heights of the bars measure the loading factor of the corresponding component for each of the tissue samples/peaks. Anatomically related samples typically have the same dominant component and have been ordered accordingly (Supplemental Table S5). The peaks that are predominantly active in the cognate tissue samples are dominated by the same component and are ordered accordingly. Thirty-one samples did not show clear tissue-specific peaks; their ATAC-seq profiles were dominated by the “ubiquitous” peaks shared by nearly all samples and, to a lesser extent, by a group of peaks assigned to the 16th “undefined” NMF component (shown in gray).

