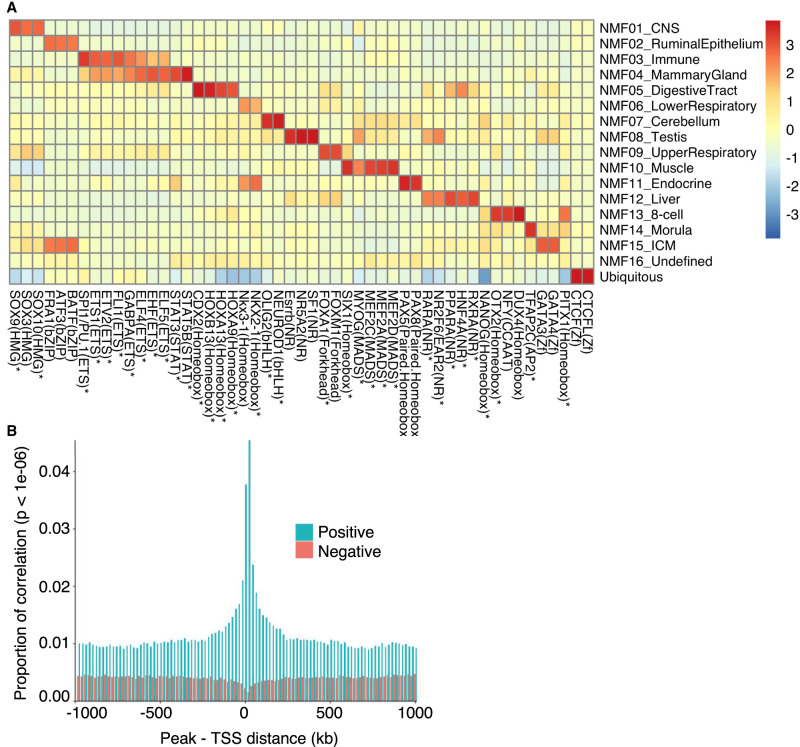
Figure 2.
Open chromatin regions are enriched in cis regulatory elements. (A) TFs (x-axis) whose binding motifs are enriched in tissue type–specific ATAC-seq peaks assigned to the corresponding NMF components (y-axis). The color code measures the excess in the percentage of peaks encompassing the corresponding motif over background, scaled (Z-score) across NMF components. TFs that are also more strongly expressed in tissues corresponding to that component compared with other tissues (Supplemental Table S7) are marked by asterisks. (B) Proportion of significant, across tissue type, correlations (P < 10–6) between ATAC-seq peak accessibility and gene expression as a function of the distance between the TSS and the peak. Green indicates positive correlations; red, negative correlations.

