Figure 3.
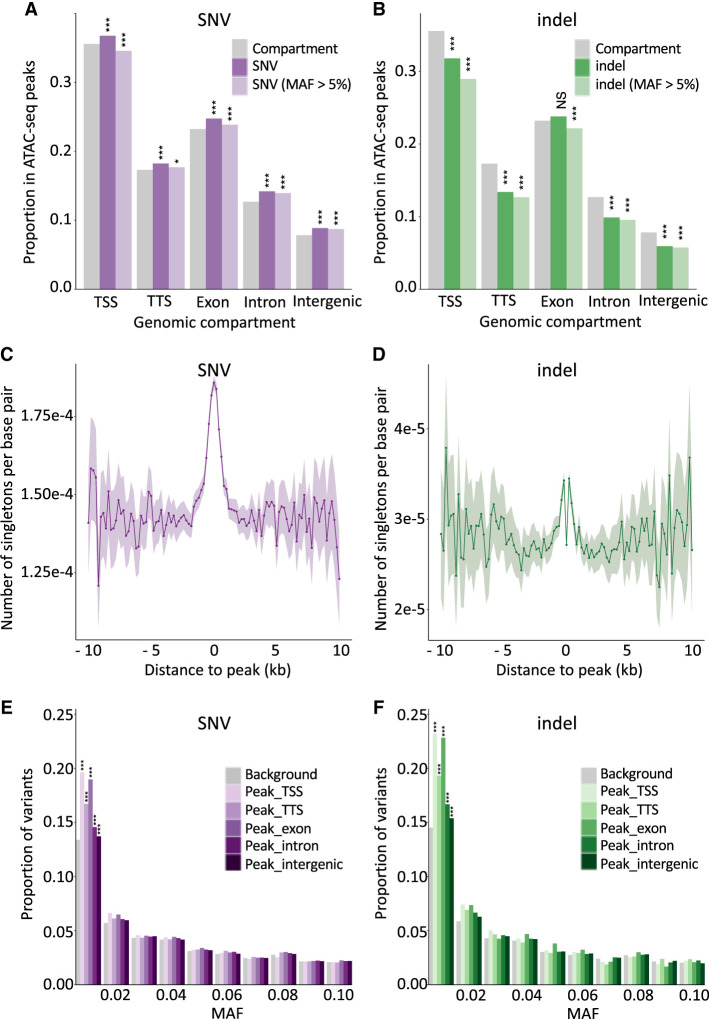
Open chromatin regions are mutational hotspots yet are subject to purifying selection. (A) Proportion of SNVs that map in ATAC-seq peaks for different genome compartments (x-axis: TSS, TTS, exon, intron, intergenic). Gray indicates the proportion of a corresponding genome compartment that is occupied by ATAC-seq peaks; dark purple, all SNVs; and light purple, common SNVs (MAF > 0.05). (***) P ≤ 0.001, (*) P ≤ 0.05. (B) As in A for indels. Gray indicates the proportion of a corresponding genome compartment that is occupied by ATAC-seq peaks; dark green, all indels; and light green, common indels (MAF > 0.05). (***) P ≤ 0.001, (NS) nonsignificant. (C) Number of singleton SNVs (per interrogated base pair) in 264 whole-genome-sequenced Holstein-Friesian (HF) animals in nonoverlapping 200-bp windows at increasing distances from the center of ATAC-seq peaks. The shaded area corresponds to 2 × SD for the corresponding window. Fluctuation increases with distance as the number of windows decreases. (D) As in C for singleton indels. The excess near the ATAC-seq peak centers is clearly visible despite the drop at their very center (assumed to reflect purifying selection). (E) Folded SFS (0.0 < MAF ≤ 0.1) for SNVs mapping within ATAC-seq peaks assigned to different genome compartments (purple range indicates TSS, TTS, exon, intron, intergenic) compared with SNVs outside peaks. (***) P ≤ 0.001. (F) Folded SFS (0.0 < MAF ≤ 0.1) for indels mapping within ATAC-seq peaks assigned to different genome compartments (green range indicates TSS, TTS, exon, intron, intergenic) compared with indels outside peaks. (***) P ≤ 0.001.

