
FIGURE 3.
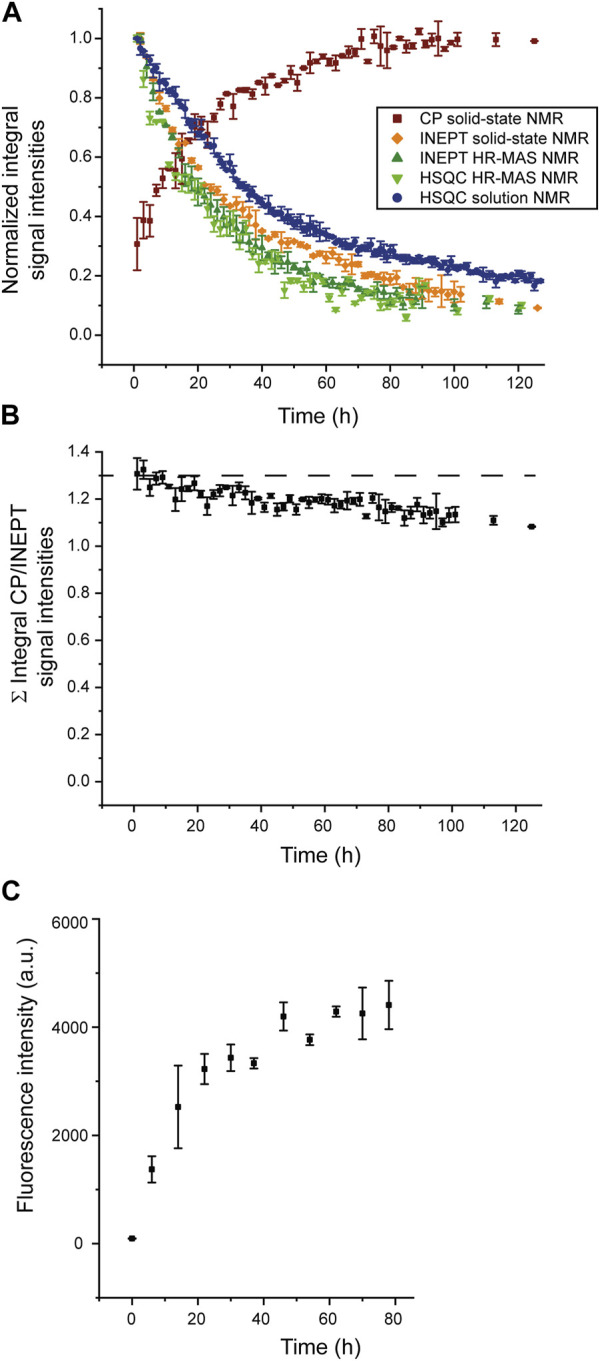
Normalized integrated intensities of NMR time series. (A) Normalized intensities of the spectra recorded at different time points during the time series, as shown in Figure 1 and Figure 2; CP-based 1D spectra (brown), first increments of solution NMR HSQC spectra (blue) or HR-MAS HSQC spectra (light green), 1D HR-MAS INEPT spectra (dark green) and INEPT solid-state NMR spectra (orange). (For the scalar coupling-based INEPT and HSQC experiments, sensitive to the monomeric species, intensities were normalized relative to the integrated intensity of the first 1D INEPT spectrum or first increment of the HSQC spectrum, respectively. For the CP-based 1D spectra, sensitive to the aggregated species, intensities were normalized relative to the last CP spectrum when spectral intensities have reached asymptotic behavior and do not grow any further. (B) Sum of normalized integrated intensities of the solid-state CP-based spectra, sensitive to the aggregated species, and the solid-state INEPT-based spectra, monitoring the decay of the monomeric species. (C) Increase of ThT fluorescence intensity due to binding to SH3 fibrils, monitored over time.