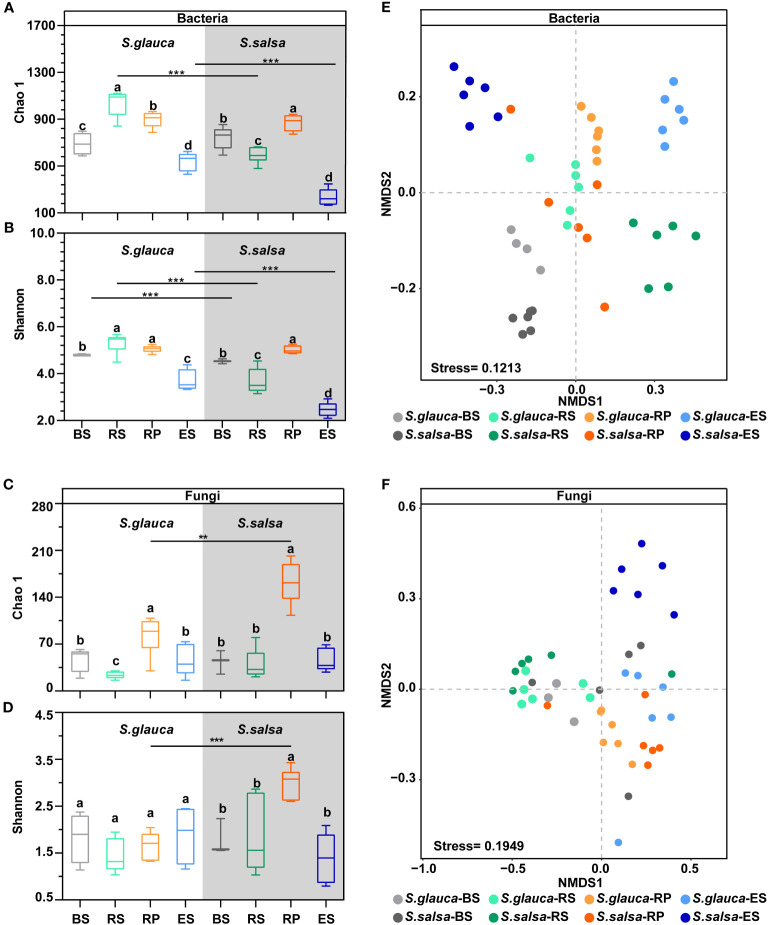
Figure 1.
The alpha and beta diversity of bacterial and fungal communities in different samples. Chao 1 (A for bacteria, C for fungi) and Shannon (B for bacteria, D for fungi) indices of the microbial community in four compartments for two plants. BS, bulk soil; RS, rhizosphere; RP, rhizoplane; ES, endosphere. The asterisks (*) indicate significant variance between S. glauca and S. salsa within the same compartments. P value of < 0.05 (*), < 0.01 (**), or < 0.001 (***). Different lowercase letters over boxplots indicates statistically significant differences (t-test, P < 0.05) across niches within one plant. NMDS plot indicating the clustering of different samples for bacterial (E) and fungal (F) communities. Samples are color-coded based on four niches and two plants.

