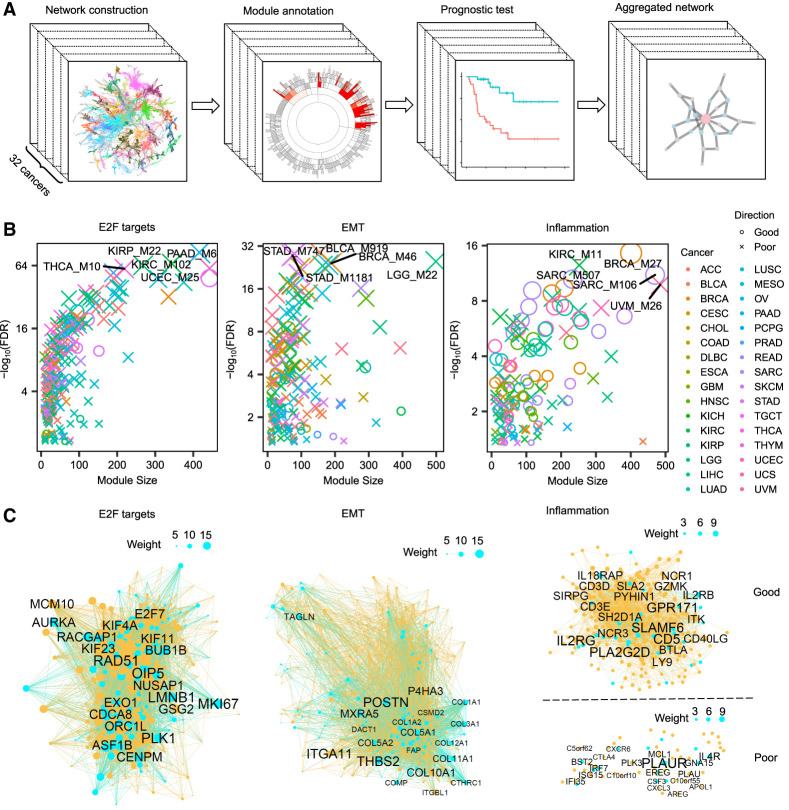
Figure 1.
Pan-cancer coexpression networks and prognostic modules. (A) The pipeline for pan-cancer coexpression network analysis, showing the steps involved in constructing coexpression networks and identifying prognostic modules. (B) Dot plots of three representative hallmark pathways of prognostic modules. For each pathway, the dots indicate the prognostic modules from 32 cancers, and the colors show the outcomes of patient survival in each cancer. The dot size is proportional to the pathway enrichment significance, with larger dots indicating stronger enrichment. The false-discovery rate (FDR) was calculated as the adjusted Fisher's exact test (FET) P-values. The top five modules with the strongest enrichment are labeled. (C) Aggregated networks of the prognostic modules in the three hallmark pathways, with blue dots indicating the pathway genes and yellow dots indicating other coexpressed genes. The node size in each network is proportional to the conservation weight across different cancers. The top 20 nodes with the strongest conservation are labeled.

