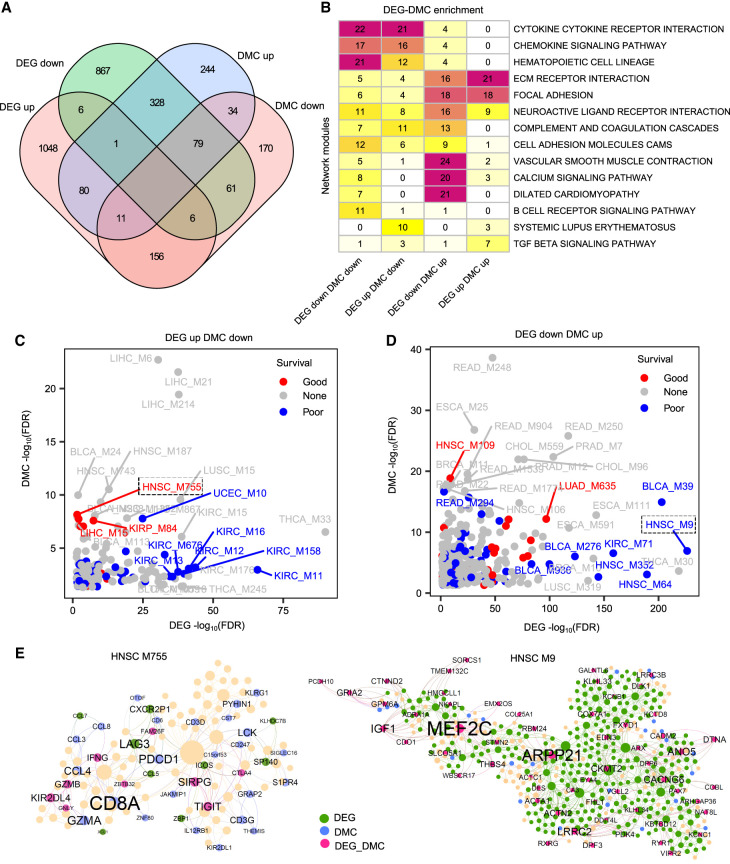
Figure 2.
Regulation of module gene expression by DNA methylation. (A) Venn diagram showing the intersections between network modules enriched with different DEG and DMC categories in 16 cancer types. (B) Heatmap showing the top KEGG annotations for network modules with different DEG-DMC categories. The number on the heatmap corresponds to the frequency of module enrichment in each KEGG pathway. (C,D) Dot plots displaying the top 15 prognostic modules enriched for different DEG-DMC categories. The x-axis and y-axis indicate enrichment of DEGs and DMCs, respectively. (E) Two representative prognostic modules of HNSC. The network plots illustrate the two prognostic modules, M9 and M755, which are enriched for different DEG-DMC categories. In the network plot, the green, blue, and purple colors indicate DEGs, DMCs, and both DEG-DMCs, respectively. Node size is proportional to the connectivity of the network.

