Figure 3.
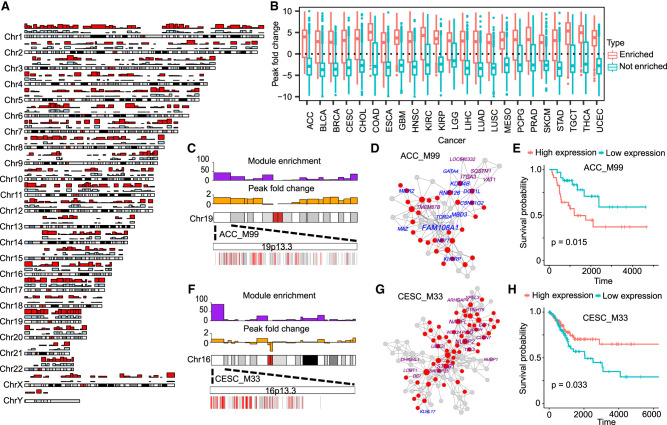
Regulation of network modules by chromatin accessibility. (A) Chromosomal cytobands with enriched network modules and open chromatins. Karyotype representation distinguishes euchromatin and heterochromatin regions using alternating light and dark shades, based on Giemsa banding. Bar plots in red and blue depict module-enriched regions and open chromatin regions, respectively. The y-axis represents the number of cancer types with the module enrichment and open chromatins, ranging from a minimum of zero to a maximum of 30. (B) Boxplot showing the fold changes of ATAC-seq peak signals in cytobands with enriched or depleted network modules compared with the genome background. (C) Prognostic module ACC_M99 enriched for the cytoband 19p13.3. The bar plots above the karyotype show module enrichment (purple) and ATAC-seq fold change (orange), respectively. The heatmap below the karyotype shows the enlarged cytoband region and the linear arrangement of module genes (red) in the cytoband. (D) Coexpression networks of ACC_M99. In the network plot, the red nodes indicate the genes in the 19p13.3 cytoband region. The names of prognostic genes are labeled by different colors (purple indicates good outcome; blue, bad outcome). (E) Survival plot of prognostic module ACC_M99. The high and low cutoffs were defined based on the median of gene expression across all tumor samples. (F–H) The cytoband enrichment (F), coexpression network (G), and survival plot (H) of prognostic module CESC_M33.

