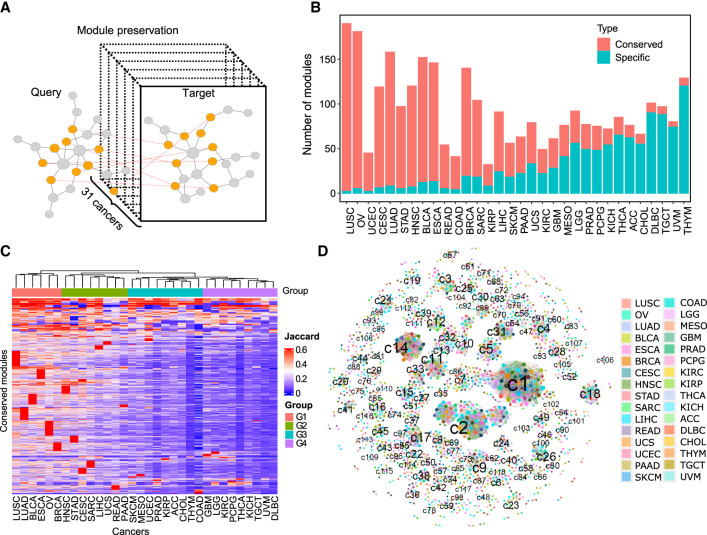
Figure 4.
Preservation of pan-cancer network modules. (A) Schematic plot illustrating the module preservation analysis pipeline. (B) The number of conserved and cancer-specific modules identified in each cancer type. (C) Cancer-type clustering based on the similarity of conserved modules. The heatmap displays the conserved modules (n = 1941) as rows and the cancer types as columns. A hierarchical clustering algorithm was used to classify cancer types based on the Jaccard index of their conserved modules. (D) The module clusters formed by conserved modules. Each cluster represents a set of reciprocal conserved modules across different cancer types. The nodes represent conserved modules, and the colors indicate cancer types. The linked nodes indicate module clusters formed by conserved modules in different cancer types.

