Figure 5.
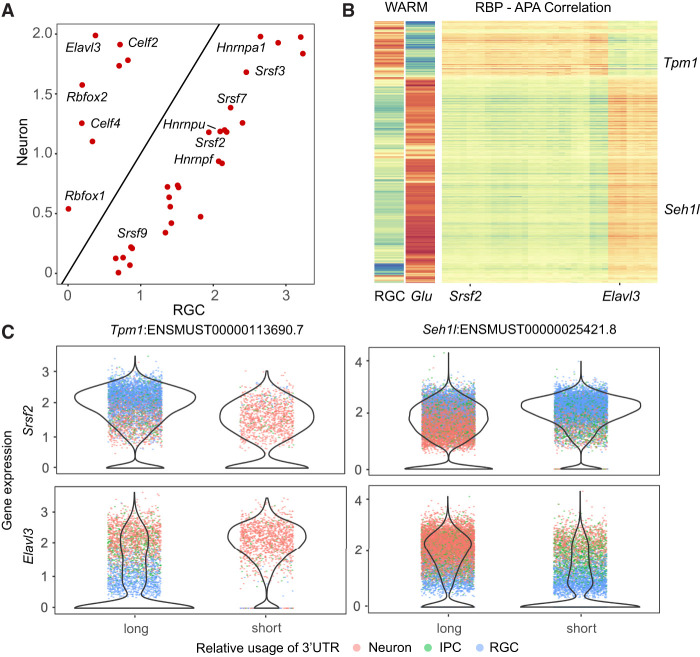
Differential APA and RBP expression in cortical neurogenesis. (A) Scatter plot showing differential expression of selected RBPs between RGCs and neurons. RBPs were selected only if their expression levels were significantly correlated or anticorrelated with 3′-UTR length changes. (B, right panel) Heat map showing the correlation of RBP expression levels and 3′-UTR lengths. APA signals were defined as transcripts with significant 3′-UTR length changes between RGC, IPC, and neurons. RBP genes were selected if (1) they were expressed in at least 10% of cells and (2) at least 10% of APA signals had a Pearson correlation coefficient >0.1 and adjusted P-values <0.05. Transcript names and orders are the same as in Figure 4D, and dorsal Glu and RGC cells were replotted to indicate the 3′-UTR length changes. (C) Violin plots showing the distribution of RBP transcript levels per cell for both high-WARM and low-WARM cell groups. Each dot represents a cell and is colored by cell types. Here we show four pairs of RBP and APA association between RBPs (rows for Srsf2 and Elavl3) and transcripts with significantly differential APA (columns for Tpm1 and Seh1l).

