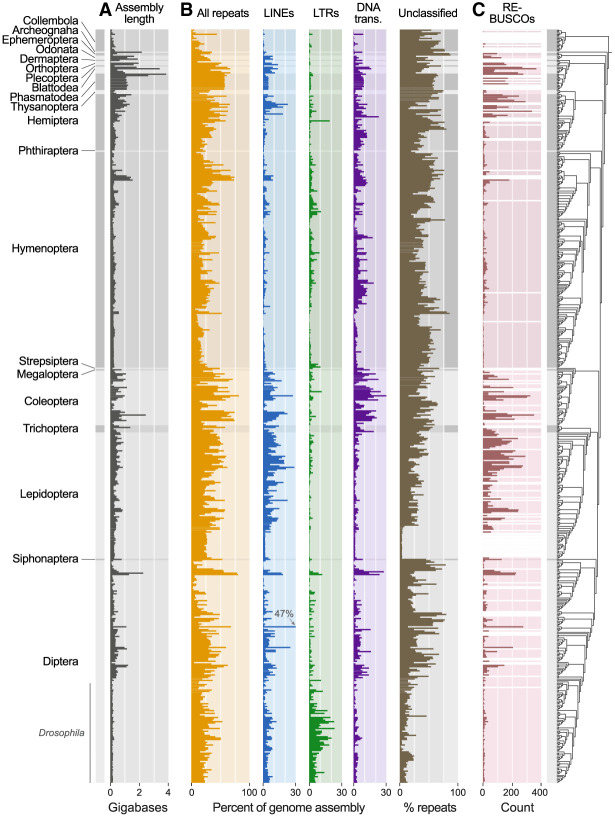
Figure 1.
The repetitive element (RE) landscape of insects. Left bars with alternating shades of gray indicate taxonomic boundaries and track across plots. (A) Total genome assembly length. (B) Overall RE abundance followed by LINEs, LTRs, and DNA transposons all as a percentage of the overall genome assembly. Totals for DNA transposons reported include TIR, Crypton, and Helitron/Polinton elements, reflecting the classification scheme of RepeatMasker, although the large majority in all cases are TIR (for a finer breakdown of these three categories, see Supplemental Fig. S2). One species (Hermetia illucens) exceeded the scale for LINEs (indicated at 47%). Any REs that could not be classified (“unclassified”) are shown as a percentage of all repeats identified for a given species. (C) Abundance of RE-associated BUSCOs. For A and B, all assemblies with BUSCO completeness ≥50% were included (n = 548). For C, because we were concerned that BUSCO completeness would alter our capacity to detect RE-associated BUSCOs, we only included assemblies with BUSCO completeness ≥90% (n = 493). A summary of less abundant repeat categories is shown in Supplemental Fig. S1 and the Supplemental Materials. Assemblies that were excluded in C are indicated with white bars. To the right of the plots, the phylogeny inferred in this study that was used to place species in their phylogenetic context is shown.

