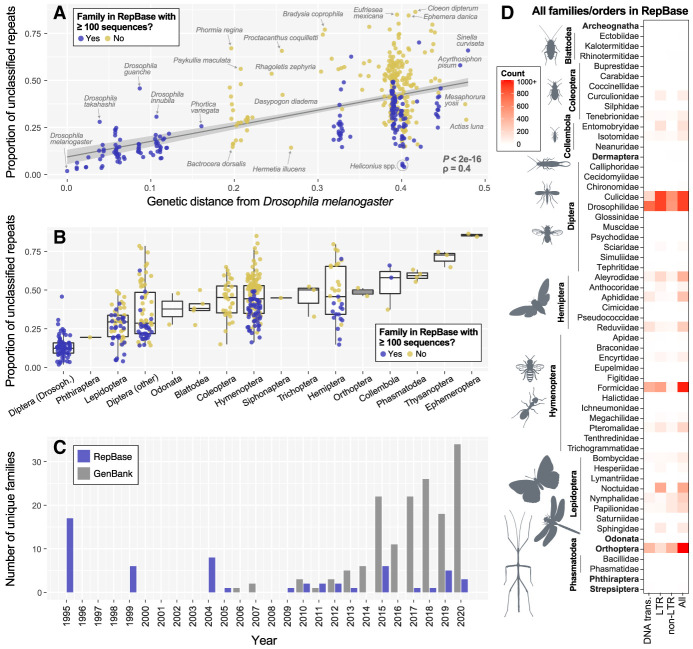
Figure 3.
Insect representation in RE databases and effects on RE detection. (A) A comparison of the proportion of total repeats that are unclassified in each insect's genome assembly versus its genetic distance from Drosophila melanogaster. (B) The same data presented in A but grouped by order except for Diptera, which are divided into family Drosophilidae and all other Diptera. In both A and B, a “yes” reflects insect family-level representation of 100 or more sequences in Repbase. (C) Unique entries at the insect family-level submitted to Repbase or GenBank from 1995–2020. Data for GenBank submissions were taken from Hotaling et al. (2021b). Of note, for 2020, only GenBank submissions through October 2020 were included. (D) Heatmap showing the abundance (count) of RE sequence entries in Repbase by order (bold) or family. Of the 154 insect families in our data set, roughly one-third, those listed here, have any representation in Repbase. Of those, many are represented by few RE sequences; for example, essentially white boxes indicate only one to 10 sequences are present. If a single insect family was present, it is labeled with the broader order name; if two or more insect families from the same order were present, they are listed with a line encompassing them to the left.

