
Fig. 1. Characterization of DRG cell types from E11.5 to P4 by mass cytometry.
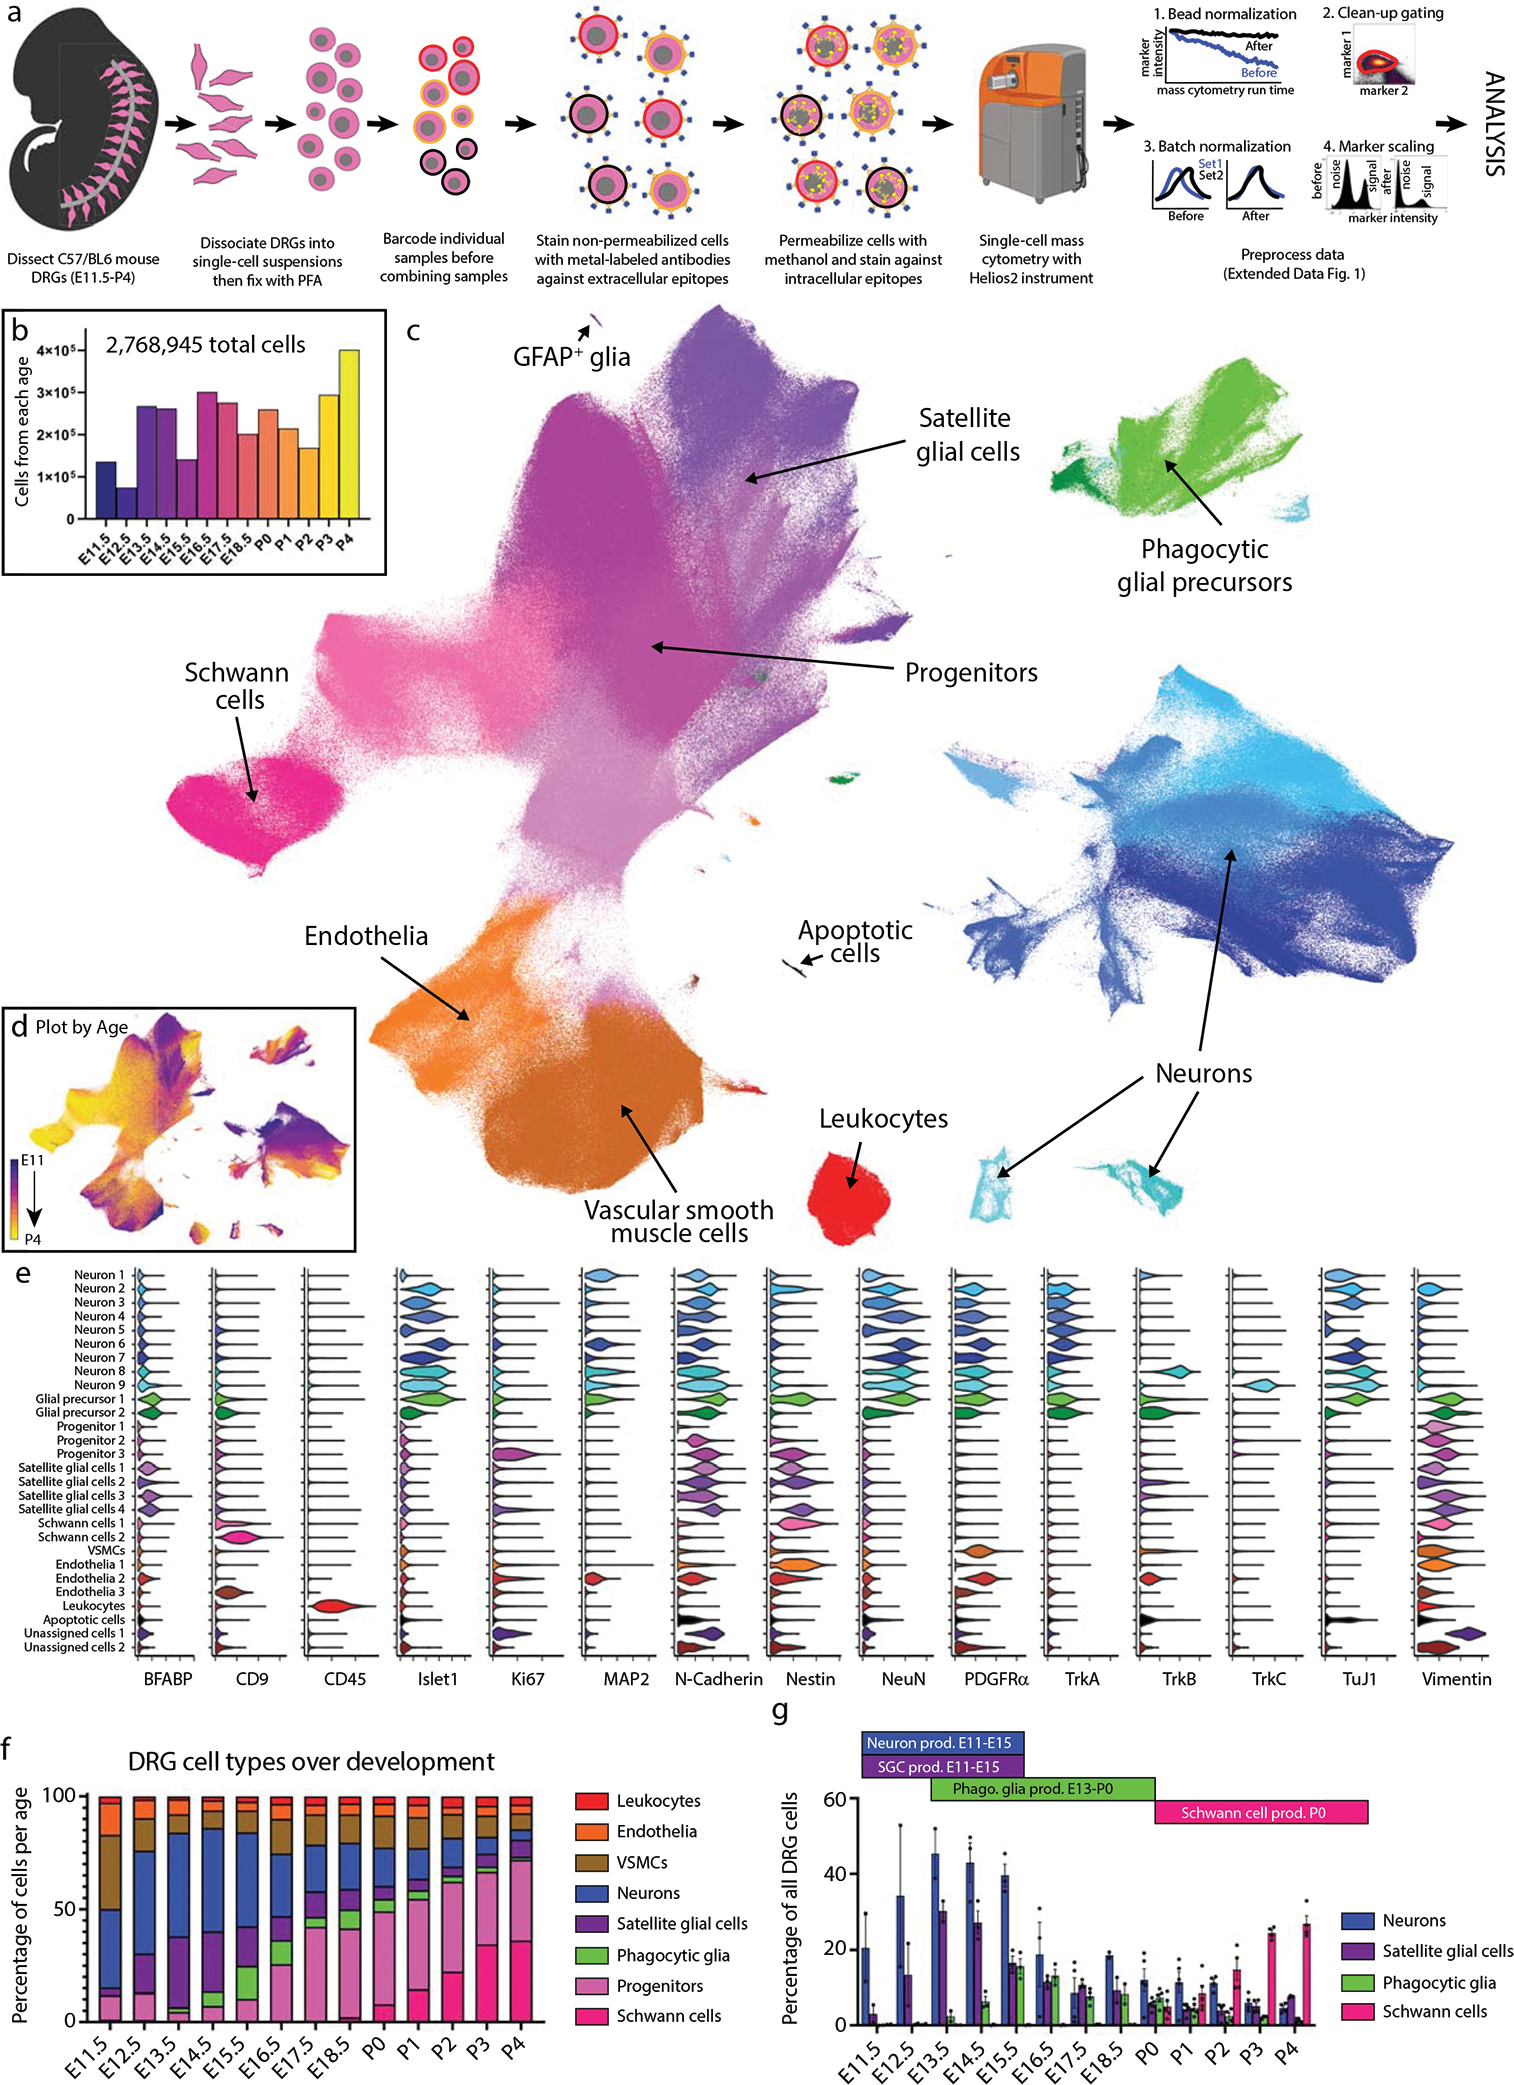
a) Neural mass cytometry workflow. Created with BioRender.com. b) Total number of clean-up gated and preprocessed cells analyzed at each day of DRG development. These show the sum of 2–4 separately analyzed litters (biological replicates) at each time point, for 43 samples in total. Bars are colored by time point. c) UMAP of all DRG cells after clean-up gating, colored by primary Leiden clustering and labeled by presumptive cell type according to protein expression profiles. d) UMAP from (c), colored by age. e) Violin plots of protein expression for clusters from c). f) The proportional abundance of major cell type classes across DRG development, created by combining the Leiden clusters from c) into 1) leukocytes: CD45+; 2) endothelia: CD31+, CD133+; 3) smooth muscle: p75NTR+, PDGFRα+, TrkB+, neuronal marker negative; 4) neurons: Islet1+, MAP2+, NeuN+, PGP9.5+, TuJ1+; 5) satellite glial cells: BFABP+, Sox10+, Vimentin+; 6) phagocytic glial precursors: BFABP+, Sox10+, Vimentin+, plus a mixture of neuronal markers such as Islet1+, MAP2+, NeuN+, PGP9.5+, TuJ1+; 7) neural progenitors: Ki67+, Nestin+, Sox10+, Vimentin+; and 8) Schwann cells: CD9+, cMet+, OligO4+. g) Changes in neuronal and glial abundance during periods of neuronal and SGC expansion, glial phagocytosis, and postnatal Schwann cell proliferation. Abbreviations: “phago.” stands for phagocytosis and “prod.” stands for production. Data are presented as mean values +/− SEM with biologically independent samples consisting of pool litters including both sexes with n=2 for E11.5-E13.5, and E18.5, n=3 for E14.5-E16.5, and n=4 for E18.5. Postnatal ages were biologically independent samples consisting of sex separated litters with n=2 of female and n=2 of male for P2-P4 and n=2 of female and n=3 of male for P0,P1. Number of pups per litter for each sample may be found in Supplementary Table 2.