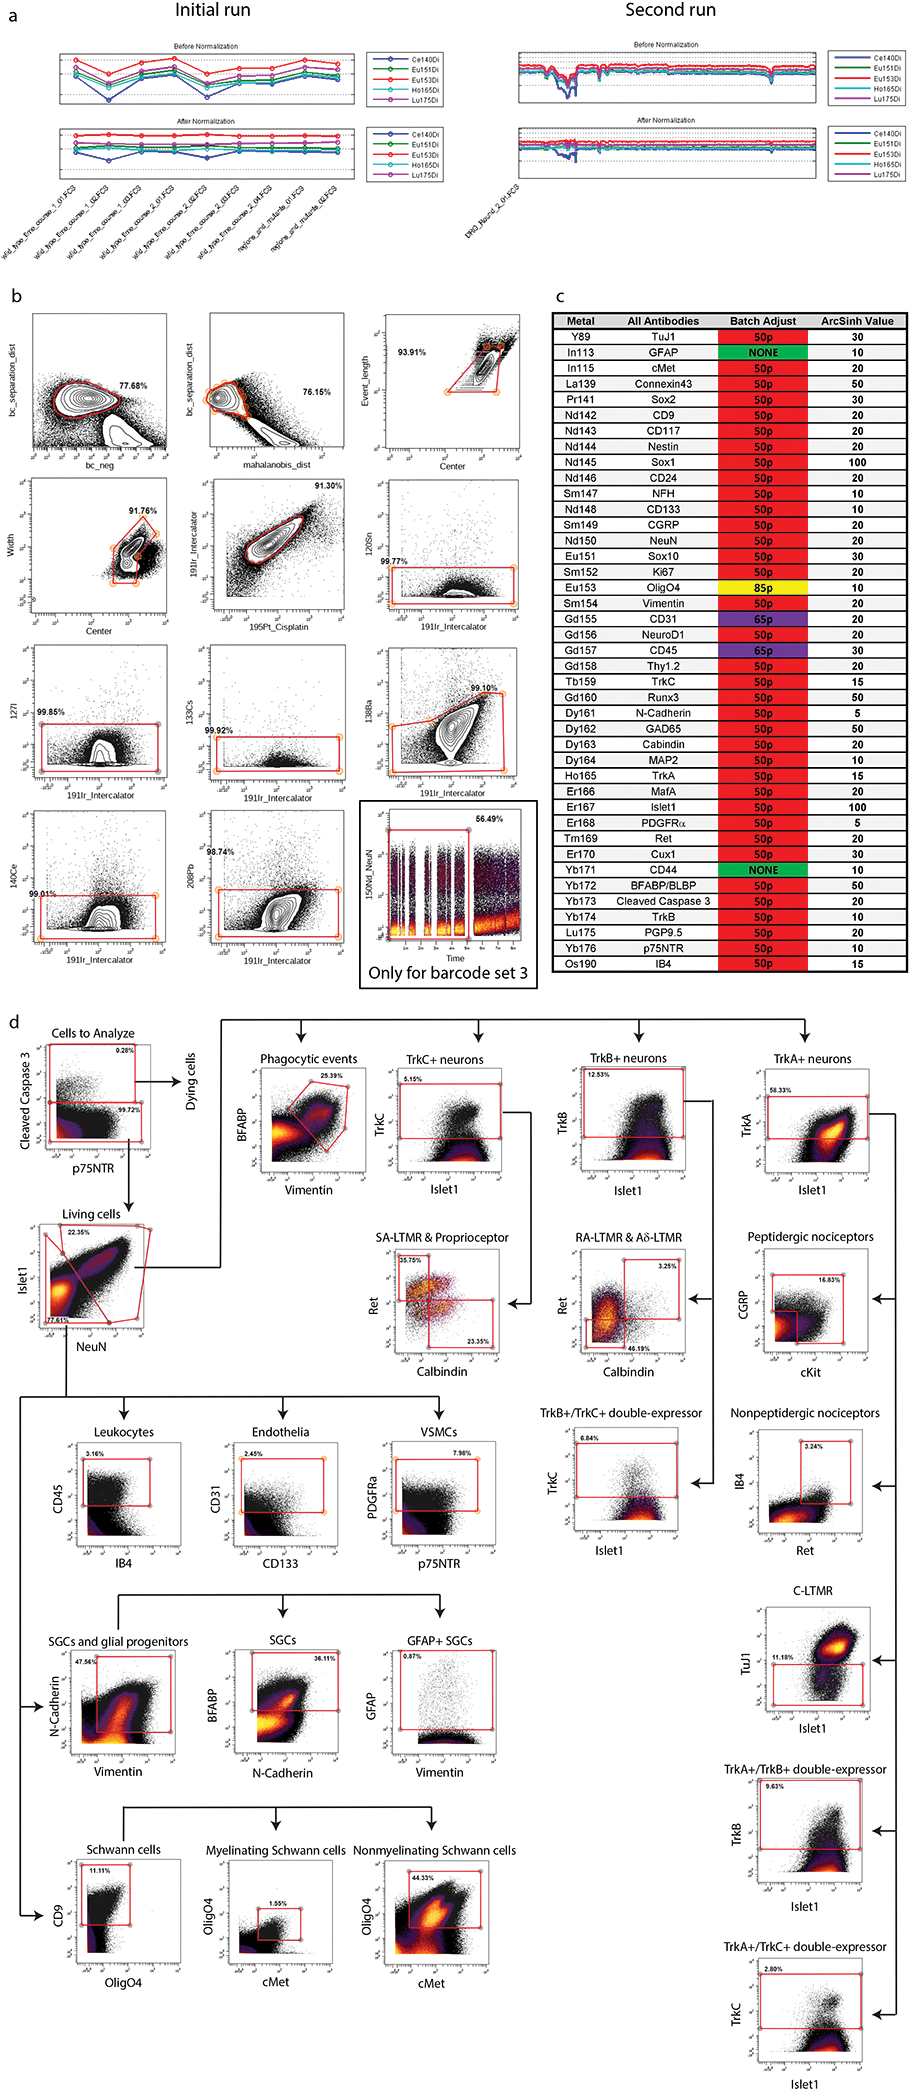
Extended Data Fig. 2. Pre-processing of DRG samples for mass cytometry.

a) Calibration bead normalization of the raw mass cytometry data (stored as .fcs files) using the Matlab software described in Finck. et al., 201335. b) Clean up gating done with Cytobank (cytobank.org) to remove low quality events from the dataset. Biaxial gates as follows (from left to right, top to bottom): 1) barcode_separation x barcode_negative and 2) barcode_separation x malahoidis_distance removes events that cannot be confidently separated by barcode label; 3) event_length x center and 4) width x center remove events that fall outside of normal Gaussian parameter distribution – these events are often enriched for cell doublets; 5) intercalator x cisplatin removes both non-cell events (e.g. cellular debris) and dying cells; 6–11) unused metals x intercalator removes high background events. A twelfth clean up gate was required for samples from barcode Set 3 to remove a runtime-dependent increase in background in a subset of channels: time x NeuN. c) Batch correction was run to normalize signal strength between runs (Schuyler et al., 2019)37. Each barcode set included a “universal” sample consisting of excess samples from across the DRG time course. These excess cells were pooled together, and then aliquoted and stored at −80°C, to be included with each mass cytometry run as an unvarying control. After all samples were run, the universal samples between barcode sets were batch corrected to be as similar as possible on a per-marker basis, and then the batch adjustment process corrected the rest of the samples in that barcode set based on its corresponding universal sample. Arcsinh transformation values were manually adjusted to provide the greatest contrast between background and physiological values. d) A gating hierarchy of major populations found by high dimensional analysis of the whole time course. This gating hierarchy recapitulates the delineation of general cell types identified through high dimensional analysis with UMAP and leiden clustering.
