
Extended Data Fig. 3. High dimensional analysis of the entire somatosensory time course data set.
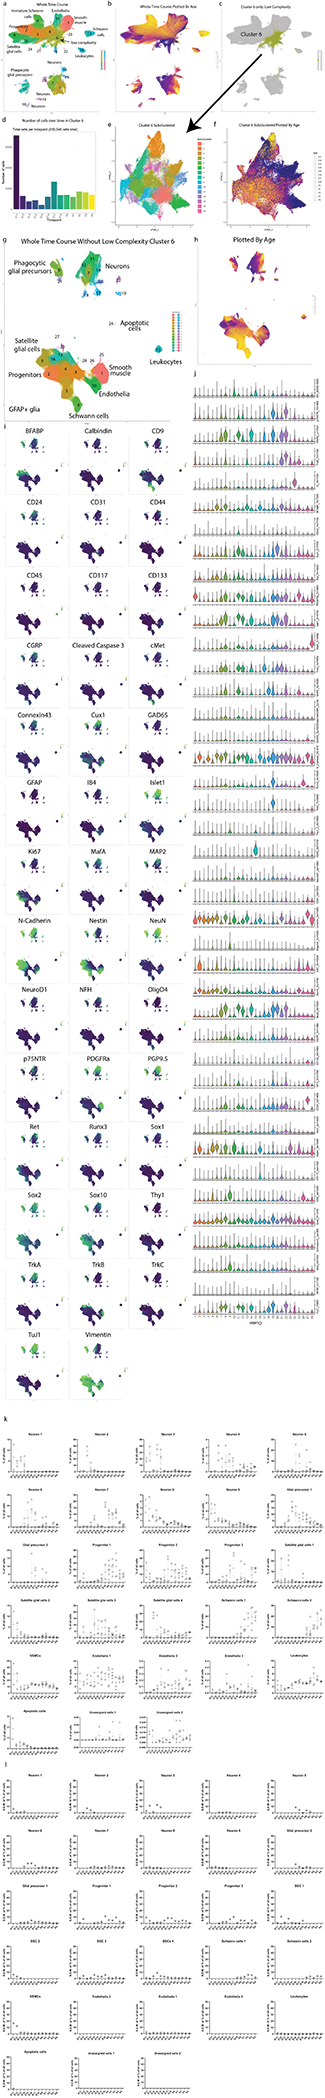
a) UMAP embedding of all ‘Cells to Analyze’ (cleanup gating applied) from the whole DRG time course. b) UMAP plot from (a) colored by age. c) UMAP plot grayed out except for low complexity Cluster 6. d) Cells from all ages in Cluster 6, with predominant contribution from E11.5. e) UMAP embedding of Cluster 6 after extraction and secondary Leiden clustering. f) UMAP plot from (e), colored by age. g) Unmodified UMAP embedding from Fig. 1c. UMAP layout was rotated and white space removed for improved visualization. h) UMAP plot from (g) colored by age. i) UMAP plot from (g) colored by expression level for every marker in the DRG antibody panel. j) Violin plots of all markers for all clusters; Fig. 1e is truncated to show just the most salient markers for the general populations. k) Analysis of the variability of each cluster by each sample at each age. The number of cells assigned to each cluster in each sample at each age was determined and the relative abundance of each cluster per sample per age calculated. Line and error bars denote the standard error of the mean. l) The standard error of the mean of the percentage of all cells for each cluster is shown, but only during the ages where the average abundance of that cluster comprised 1% or more of the cells at that age. Note, three clusters (Endothelia 3, Unassigned cells 1, and Unassigned cells 2) never reached that threshold.