
Extended Data Fig. 5. High dimensional analysis of all glial cells and precursors.
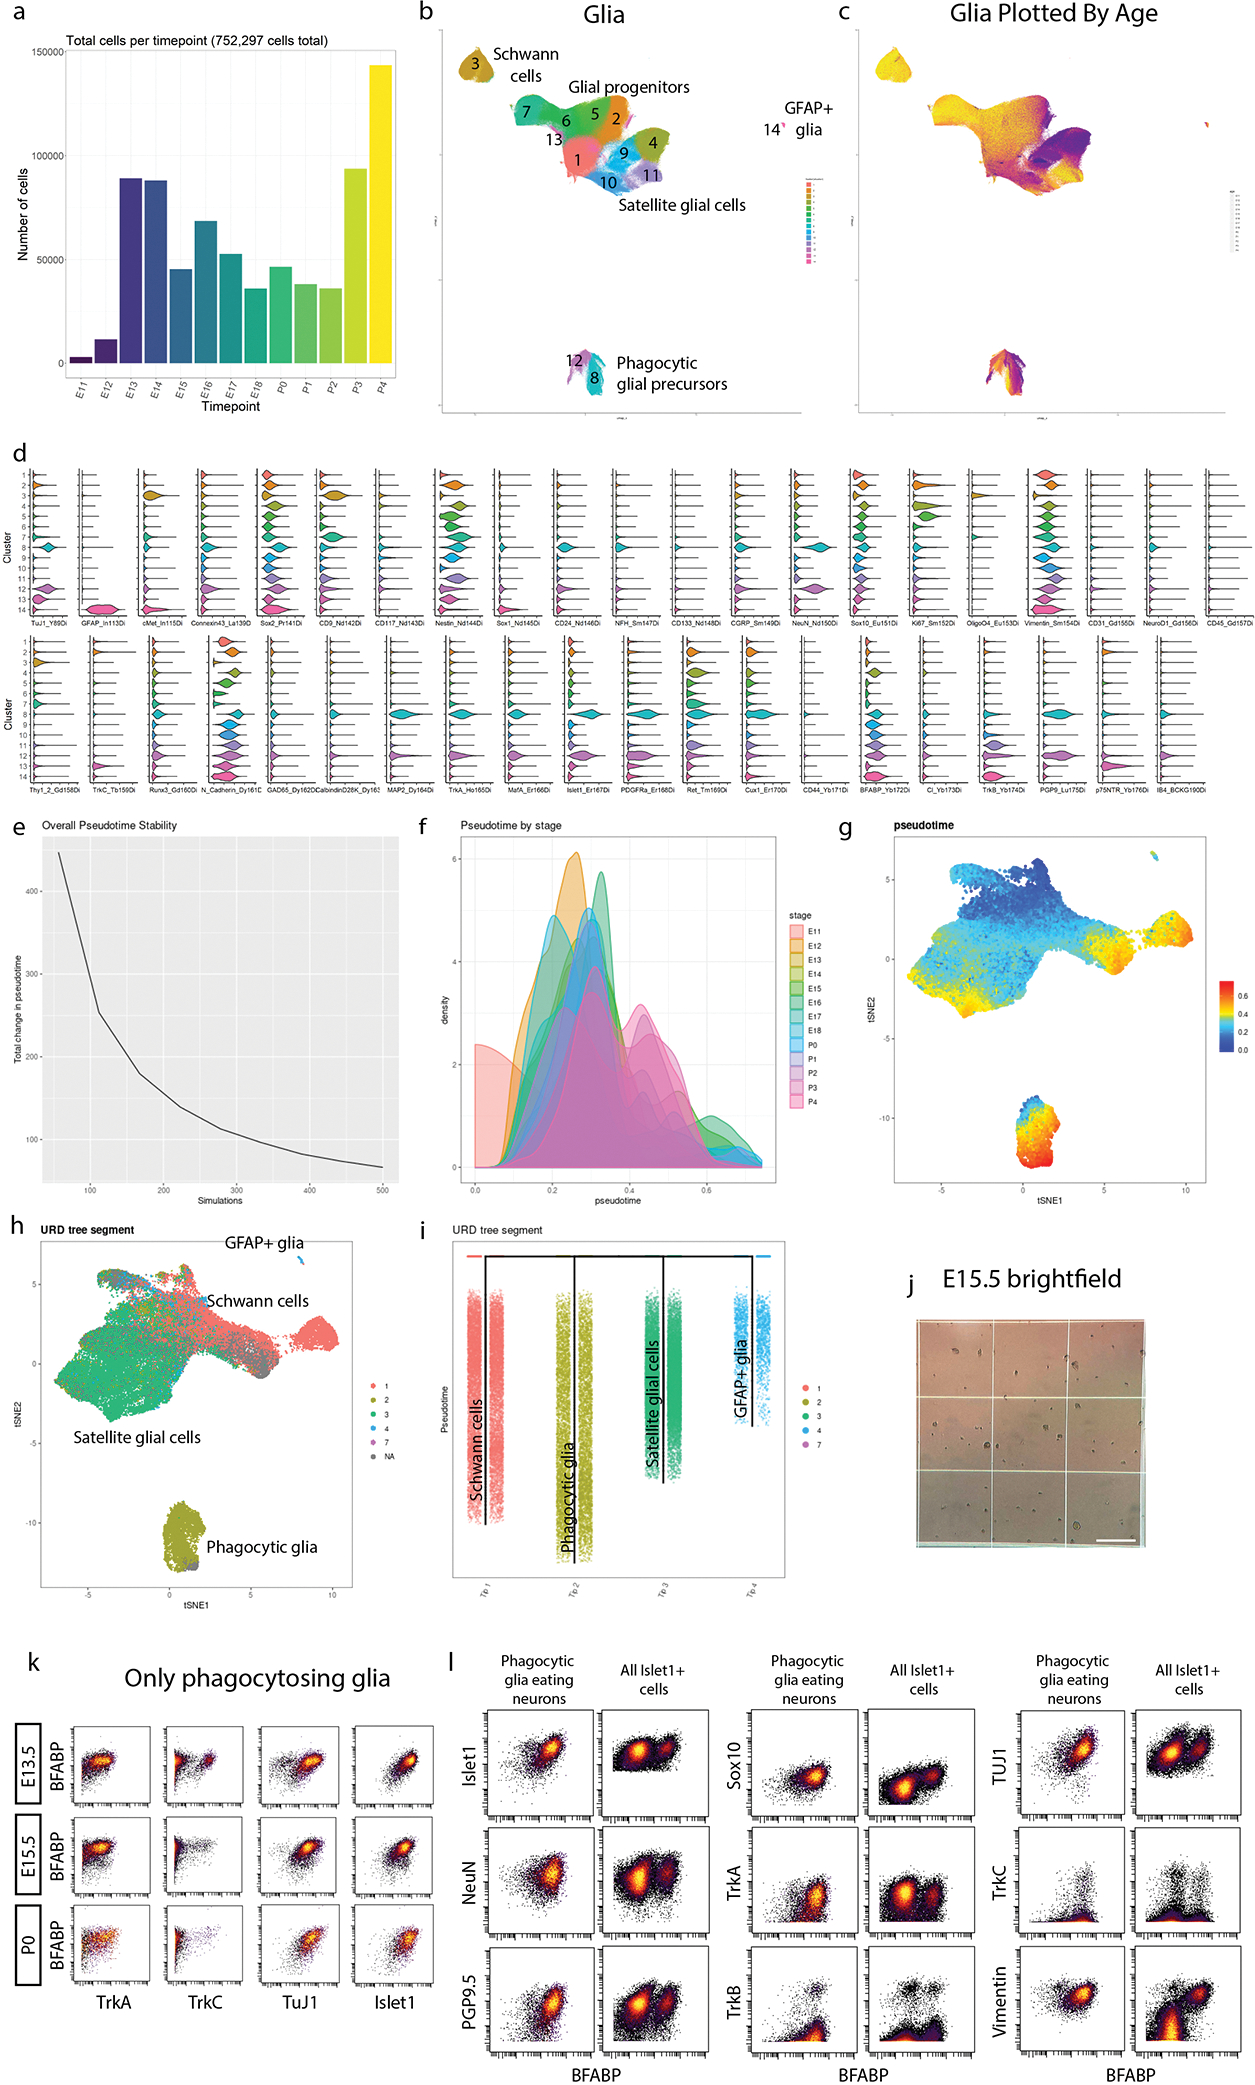
a) Cell number per age for all glia and glial precursors. b) Unmodified UMAP embedding from Fig. 3a. White space was trimmed for ease of visualization. c) UMAP plot from (b) colored by age. d) Violin plot of all markers for the glial clusters (from Fig. 3a) e) During pseudotime calculation, several simulations are run, allowing pseudotime to be calculated from these iterations. For ideal pseudotime stability (e.g. decreased change in cell pseudotime with increasing runs) we assessed the number of runs required to approach an asymptote. We determined 500 simulations was sufficient to reach a stability asymptote. f) We next assessed the distribution of pseudotime by real age (E11.5 to P4). There is a general progression across pseudotime with age with overlap between stages, as expected. g) UMAP plot colored by pseudotime value for all 63,796 downsampled cells included in this analysis. h) UMAP plot from (g) colored by URD segment. i) URD dendrogram of the 4 general populations colored by segment. j) Representative brightfield image of E15.5 sample on a hemocytometer quantified in Fig. 3p. Scale bar, 500μm.k) Biaxial scatterplots from only putative phagocytic glia showing expression of 4 neuronal markers (TrkA,TrkC, TuJ1, and Islet1), by satellite glial cell marker BFABP at E13.5, E15.5, and P0. l) Biaxial scatterplots comparing marker expression for several neuronally expressed markers (Islet1, NeuN, PGP9.5, TuJ1, TrkA, TrkB, and TrkC) and glial markers (Sox10, TrkB, and Vimentin) by BFABP between only putative phagocytic glia and all Islet1+ cells (neurons and putative phagocytic glia) from all ages.