
Extended Data Fig. 6. High dimensional analysis of all neurons.
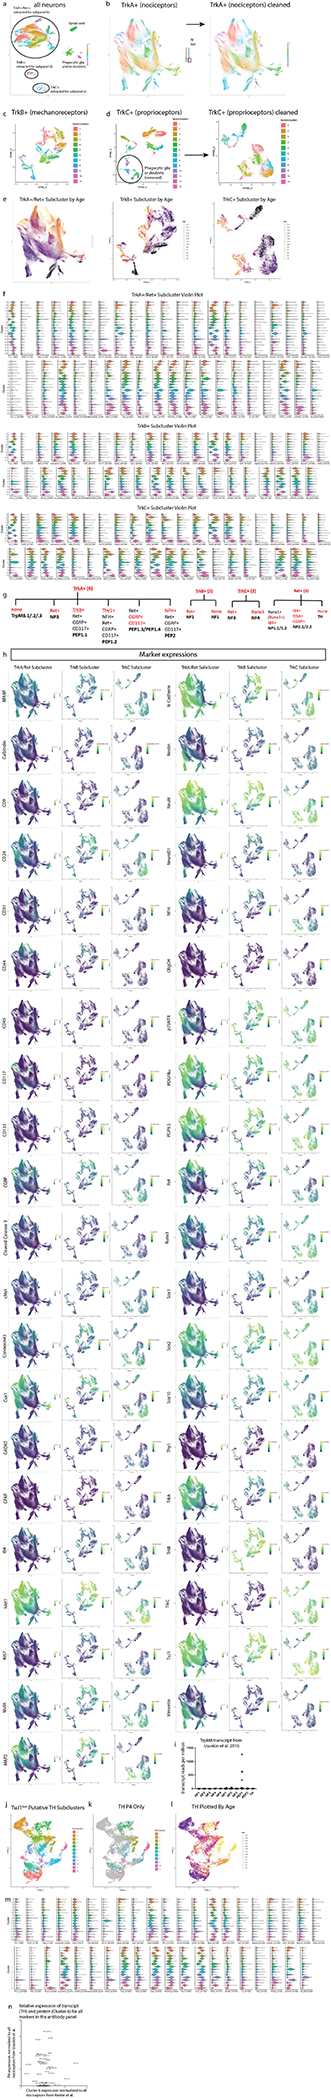
a) Leiden clustering (LC) and UMAP embedding of neurons extracted from the whole time course, labeled by cell type. Circles indicate the 3 main neuronal subtypes by RTK expression: TrkA+;Ret+, TrkB+, and TrkC+, respectively. b) LC and UMAP of the TrkA+;Ret+ neurons, extracted from a). Three clusters that did not exhibit neuronal markers were removed from the dataset before a final round of LC and UMAP (plot on right). c) LC and UMAP of the TrkB+ neurons extracted from a). d) LC and UMAP of the TrkC+ neurons extracted from a). Putative phagocytic glia expressing TrkC+ could not be removed from TrkC+ neurons in previous analytic iterations, but this could be done at this resolution resulting in a “cleaned” TrkC+ neuronal clustering and UMAP (plot on right). e) TrkA+;Ret+, TrkB+, and TrkC+ UMAP plots colored by age. f) Violin plots of all markers for TrkA+;Ret+, TrkB+, and TrkC+ neurons. g) Key markers in our panel that allow identification of somatosensory DRG populations5. h) UMAP plots colored by expression for all panel markers for TrkA+;Ret+, TrkB+, and TrkC+ neurons. i) TrpM8 transcript data from Usoskin et al., 2015 showing that TrpM8-expressing neurons are a subset of peptidergic nociceptors. j) UMAP plot of TH+ cells that were extracted from Fig. 4a (Cluster 6) and reclustered. k) UMAP plot of the TH+ cells from P4 overlaid on the grayed out UMAP plot from j). These were the cells used in the comparison to the Usoskin et al., 2015 transcript data in Fig. 4 i–n. l) UMAP plot from j) colored by age. m) Violin plot of marker expression of all clusters from j). n) Comparison of TH+ C-LTMR transcripts expression to protein expression for all markers in the mass cytometry panel2. In both cases, transcript or protein expression in C-LTMRs was normalized to all nociceptors.