
Extended Data Fig. 7. Analysis of inter-replicate variability for TrkA+, TrkB+, and TrkC+ neuron subclusters.
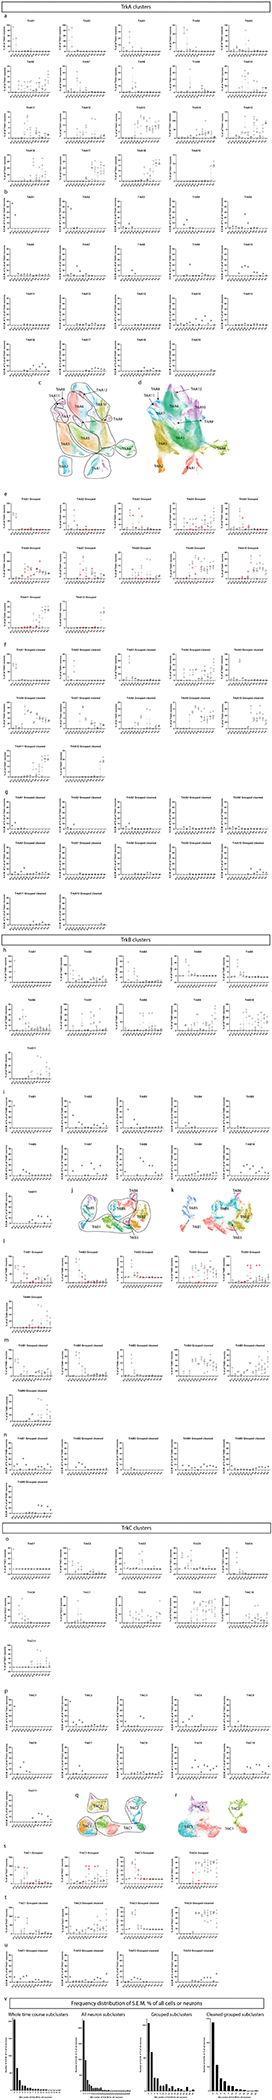
a) Analysis of the variability of each cluster by each sample for each age for the TrkA+/Ret+ neuron subcluster. The number of cells assigned to each cluster in each sample at each age was determined and the relative abundance of each compared to all neurons in the TrkA+/Ret+ cluster was calculated. b) The standard error of the mean of the percentage of all neurons from the TrkA+/Ret+ dataset for each TrkA+/Ret+ cluster is shown, but only during the ages where the average proportion of that cluster comprised 1% or more of the cells at that age. c) UMAP where TrkA+/Ret+ subclusters have been grouped together by similar expression of markers into a more general cell type. d) UMAP where TrkA+/Ret+ subclusters were recolored by general groups expressing similar markers as denoted in (c). e) The relative abundance for the general groups created in (d) are shown with the samples deemed ‘poorer quality’ (see Supplementary Table 3) indicated as a red circle. f) The relative abundance for the general groups created in (d) shown without the ‘poorer quality’ samples. g) The standard error of the mean of the percentage of all neurons from the grouped TrkA+/Ret+ dataset with the ‘poorer quality’ samples data removed for each TrkA+/Ret+ cluster is shown, but only during the ages where the average proportion of that cluster comprised 1% or more of the cells at that age. h-n) The same analysis as (a-g) except for TrkB+ neurons. (o-u) The same analysis as (a-g) except for TrkC+ neurons. v) Frequency distribution of the S.E.M % of either all cells or neurons for 1) the whole time course (from Extended Data Fig. 3k,l), 2) all neuron subclusters, 3) subclusters grouped by general cell types, and 4) these general cell types with the ‘poorer quality’ samples removed.