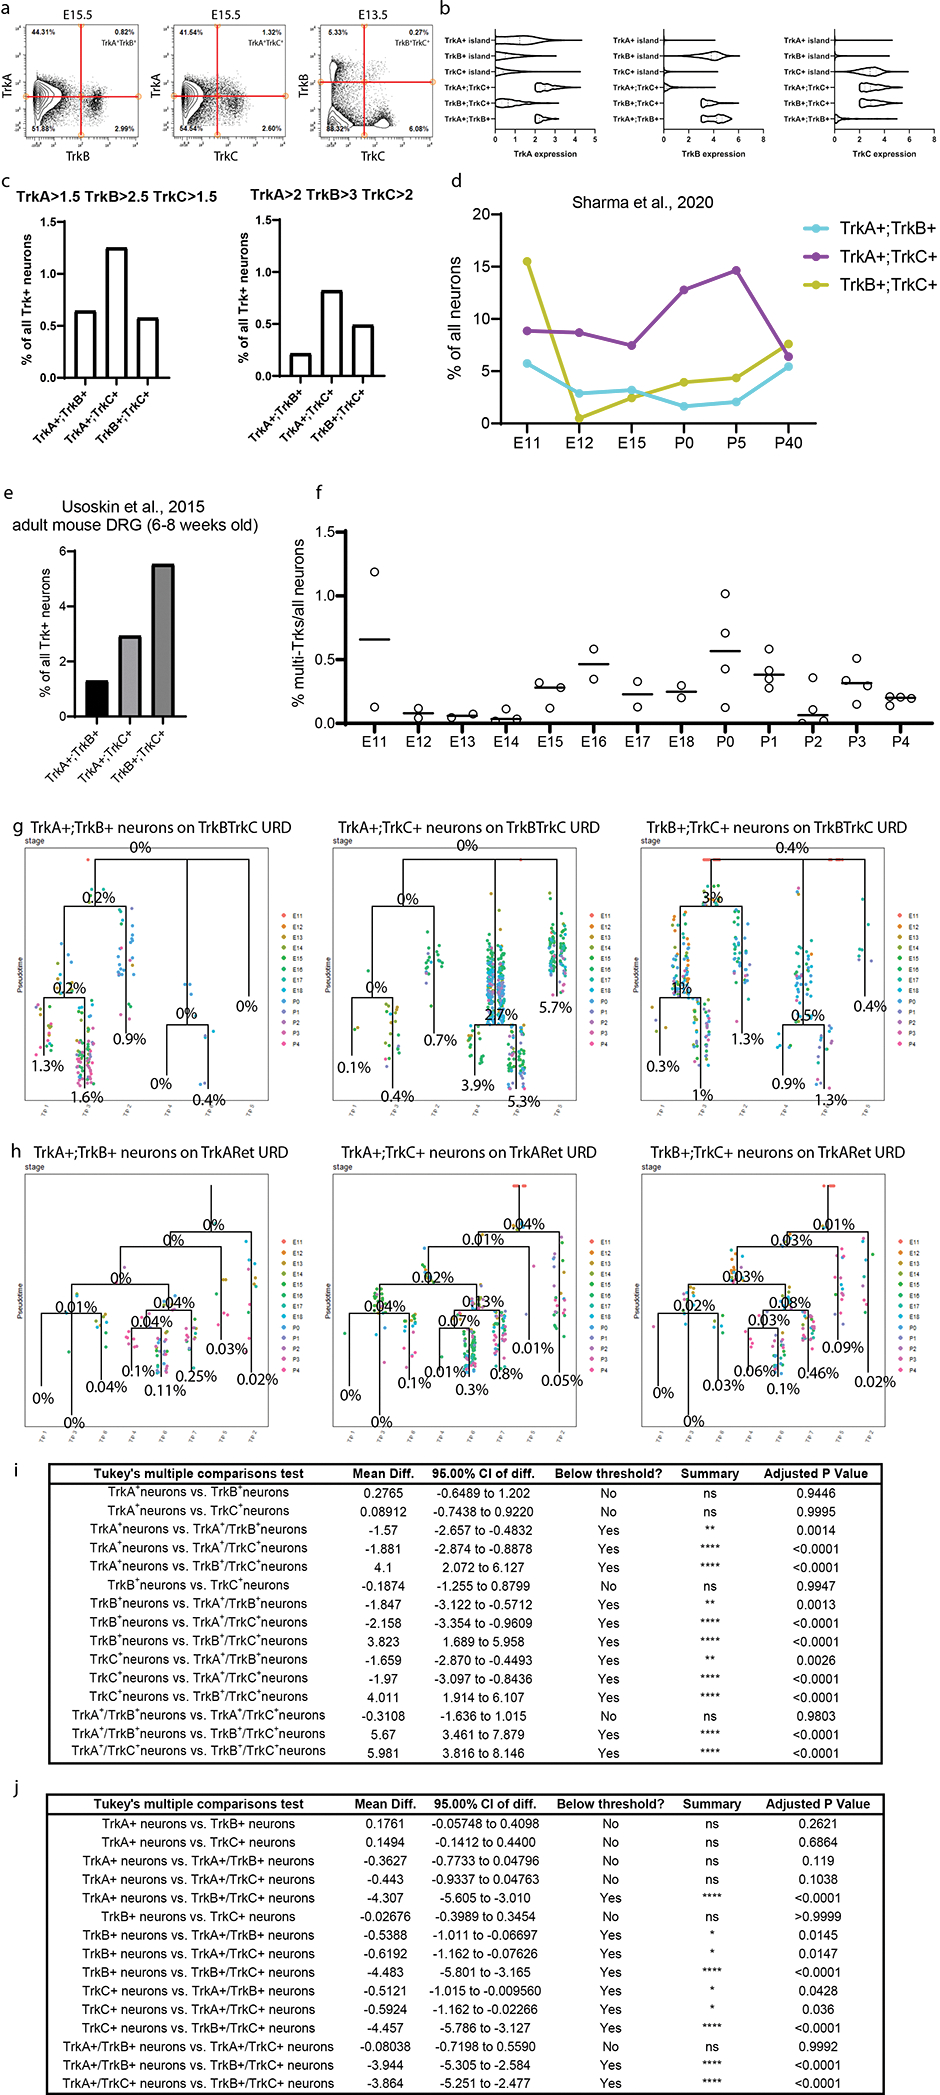
Extended Data Fig. 9. Multi-Trk+ neurons exhibit altered protein expression.

a) Biaxial scatterplots showing the neurons that express at least two Trks for all 3 combinations: TrkA;TrkB, TrkA;TrkC, and TrkB;TrkC. b) Violin plots of Trk expression for all single-Trk+ neurons (Fig. 4 a–c) compared to multi-Trk+ neurons. c) Proportion of TrkA+;TrkB+, TrkA+;TrkC+, and TrkB+;TrkC+ populations at different threshold values: left, TrkA>1.5, TrkB>2.5, TrkC>1.5 and right, TrkA>2, TrkB>3, TrkC>2. d) Proportion of TrkA+;TrkB+, TrkA+;TrkC+, and TrkB+;TrkC+ populations at E11, E12, E15, P0, P5, and P40 from Sharma et al., 2020 scRNA-seq. All cells with transcript expression values >0 were designated as expressing the given transcript. e) Proportion of TrkA+;TrkB+, TrkA+;TrkC+, and TrkB+;TrkC+ populations at P42–56 from Usoskin et al., 2015. Transcript expression was determined by thresholding as in Usoskin et al., 2015: briefly, the three cells with the highest expression for a given transcript were averaged and then multiplied by 5%. Cells with transcript expression greater than this threshold are designated as expressors. f) Proportion of all multi-Trk+ neurons combined at each age across the whole time course from the mass cytometry dataset. g,h) URD dendrograms from Fig. 5a without the URD dataset cells. Instead, each multi-Trk+ neuron type are mapped on the URDs, colored by the age of each cell, over the TrkB;TrkC URD (d) and the TrkA;Ret URD (e). Multi-Trk+ neuron numbers were counted and compared to the number of cells within each TrkB;TrkC URD segment (d). However, the TrkA+ and Ret+ neurons were downsampled (64,997 out of 492,982 neurons). Thus we multiplied the number of neurons in each segment of the TrkA;Ret URD by the downsampling coefficient (7.584689) before determining the proportion of multi-Trk+ neurons over the URD (e). i,j) All p Values for Fig. 6l and m, respectively.
