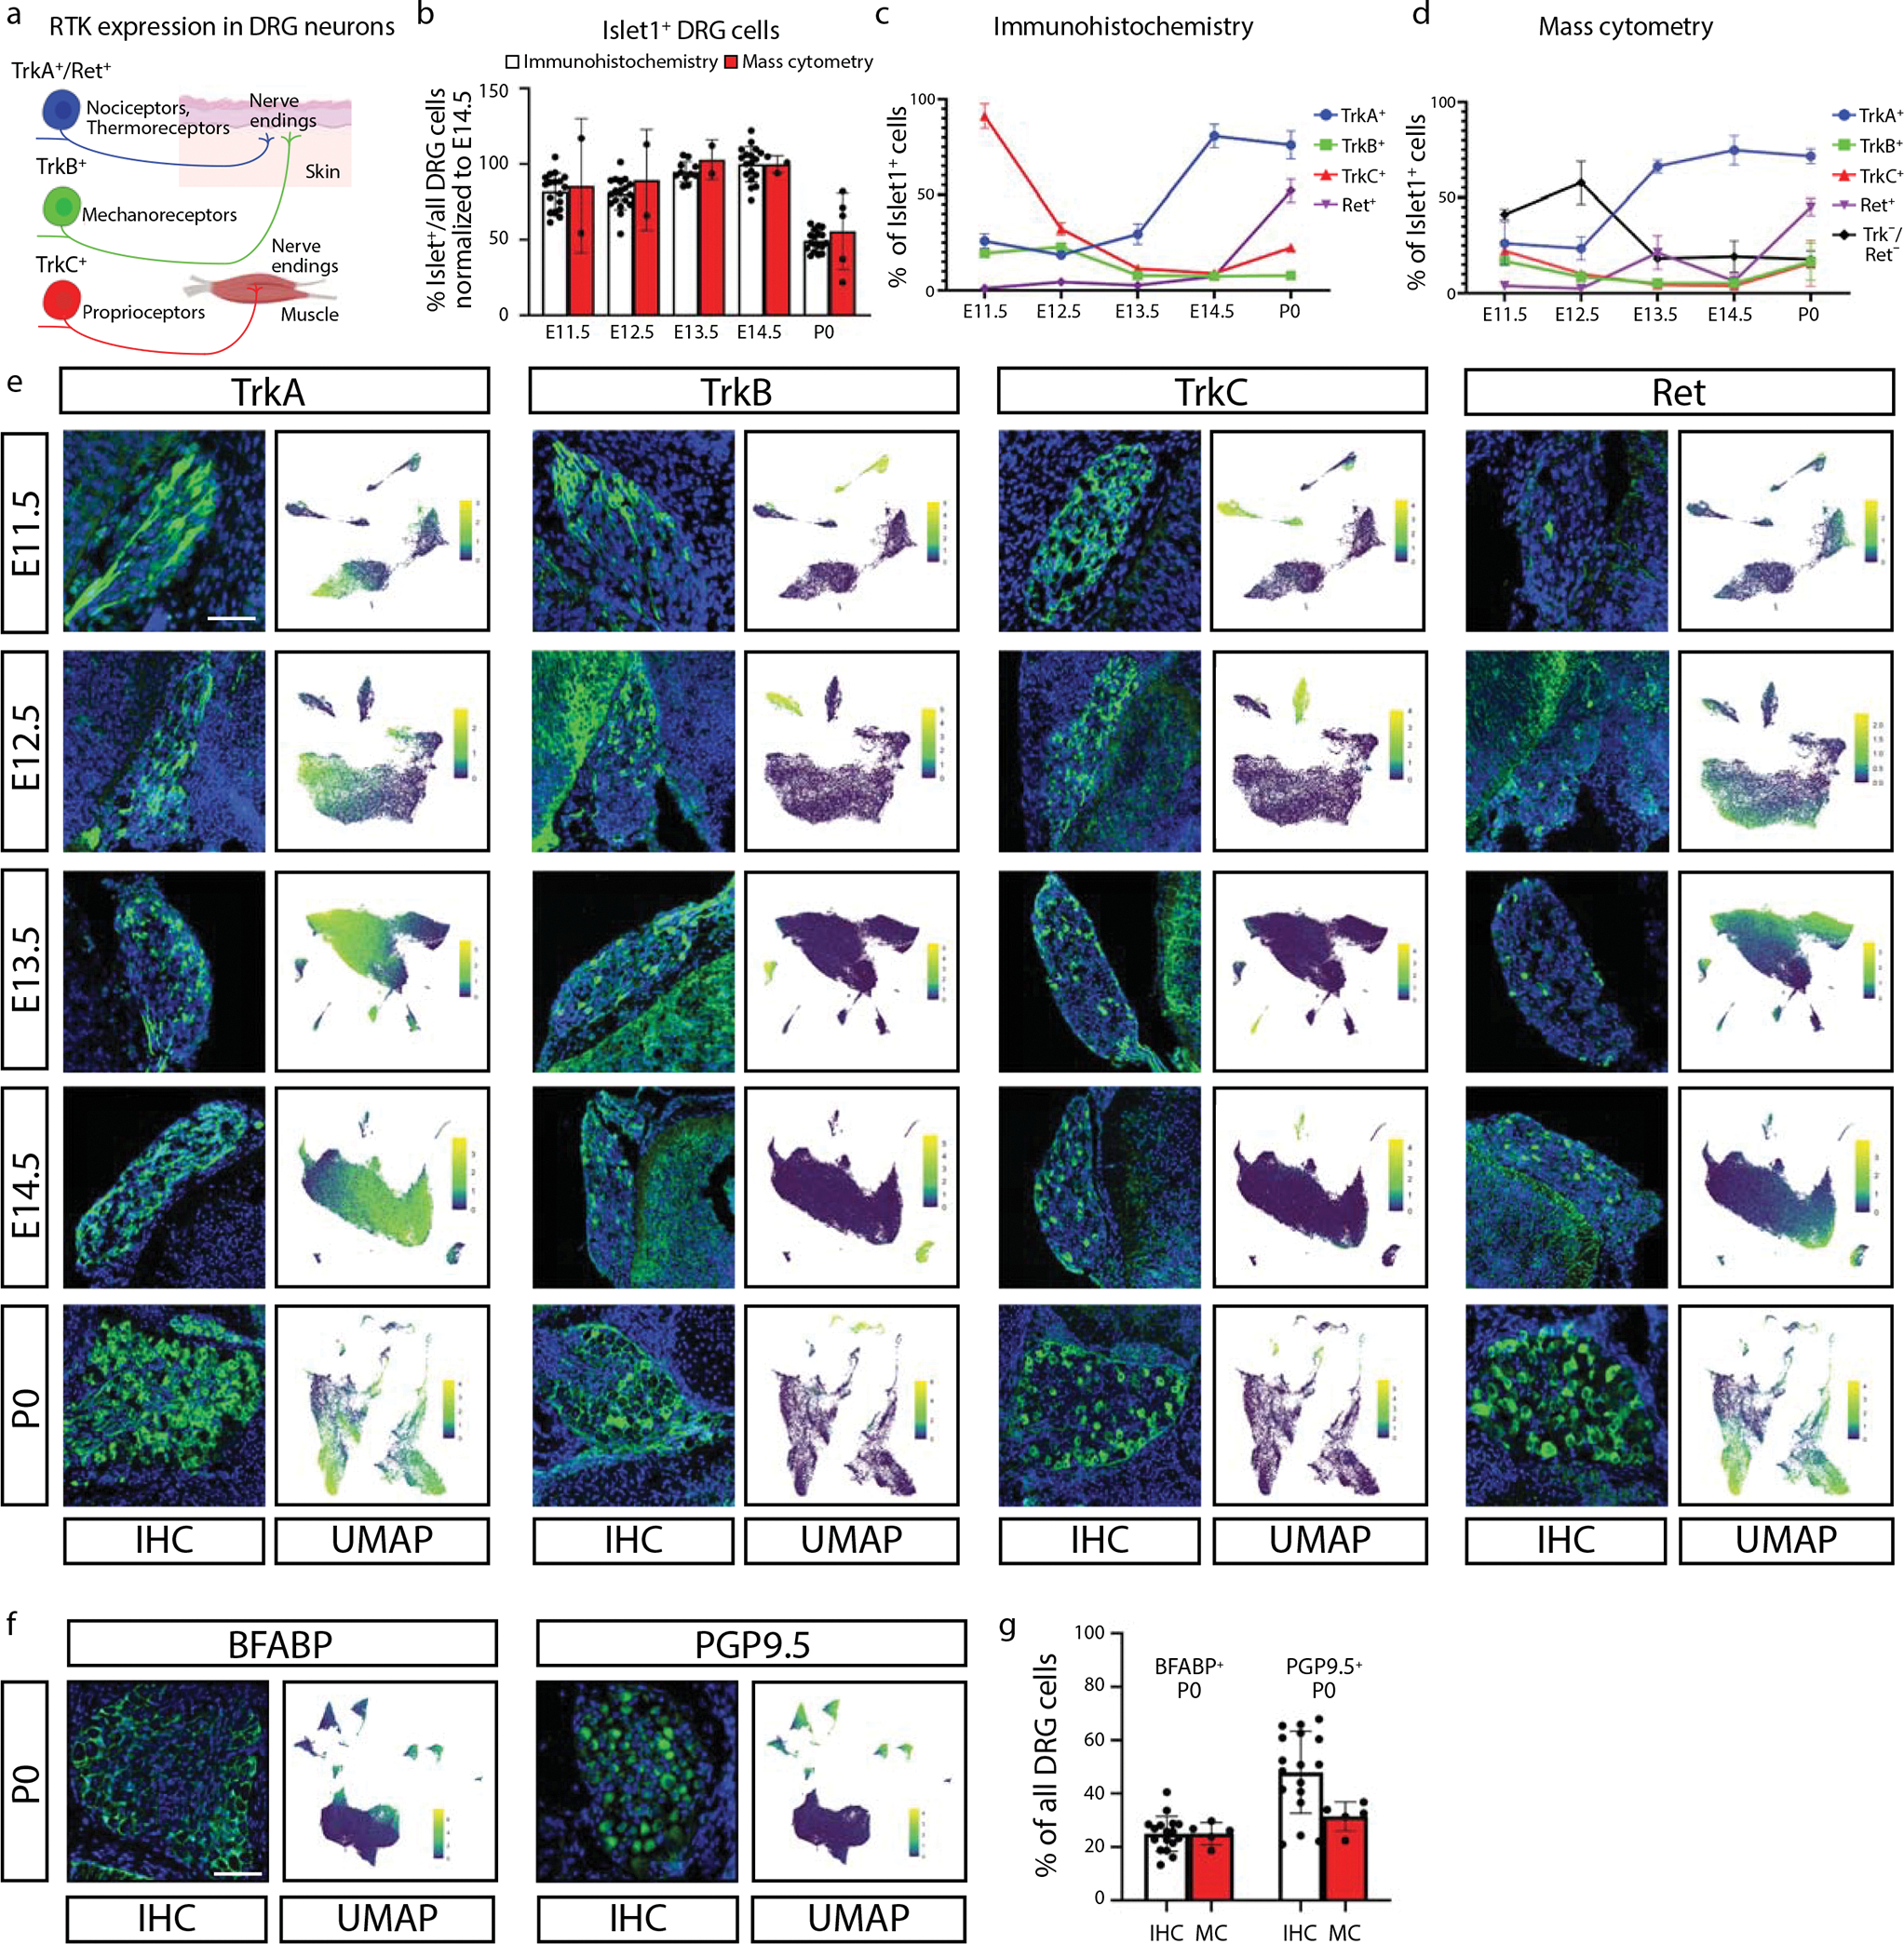
Fig. 2. Comparison of DRG analysis by mass cytometry and IHC.

a) Schematic illustration of somatosensory neuron subtypes divided by TrkA+, TrkB+, TrkC+, and Ret+ expression during development. Created with BioRender.com. b) Proportion of Islet1+ cells out of all DRG cells, by IHC and mass cytometry. All ages are normalized to E14.5, the peak of Islet1+ cell abundance by IHC. Data are presented as mean values +/− SEM with biologically independent samples as in Fig. 1g except just E11.5-E14.5 and P0 for the mass cytometry and 1 or 2 sections from the L4 DRG of 3 mice (sexes unknown) from 3 litters, thus 17 datapoints for IHC at each age. c,d) Proportion of TrkA+, TrkB+, TrkC+, and/or Ret+ neurons across matching timepoints between IHC (c) and mass cytometry (d), respectively. Mass cytometry also identifies the number of neurons that express Islet1 but none of TrkA, TrB, TrkC, or Ret. Data are presented as mean values +/− SEM with the same samples in Fig. 2b. e) Representative IHC of lower lumbar (L3-L6) DRGs stained for TrkA, TrkB, TrkC, or Ret; at ages E11.5, E12.5, E13.5, E14.5, and P0 quantified in (c,d). IHC images are paired with mass cytometry UMAP layouts from neurons of the corresponding age, colored by protein expression for each RTK. Scale bar, 100μm. f) Representative IHC of P0 DRGs for BFABP and PGP9.5 quantified in (g), and UMAP layouts of all P0 DRG cells colored by expression of these two markers. Scale bar, 100μm. g) Relative abundance of BFABP+ and PGP9.5+ DRG cells at P0 by IHC or mass cytometry. Data are presented as mean values +/− SEM with the same samples as in Fig. 2b except just P0.
