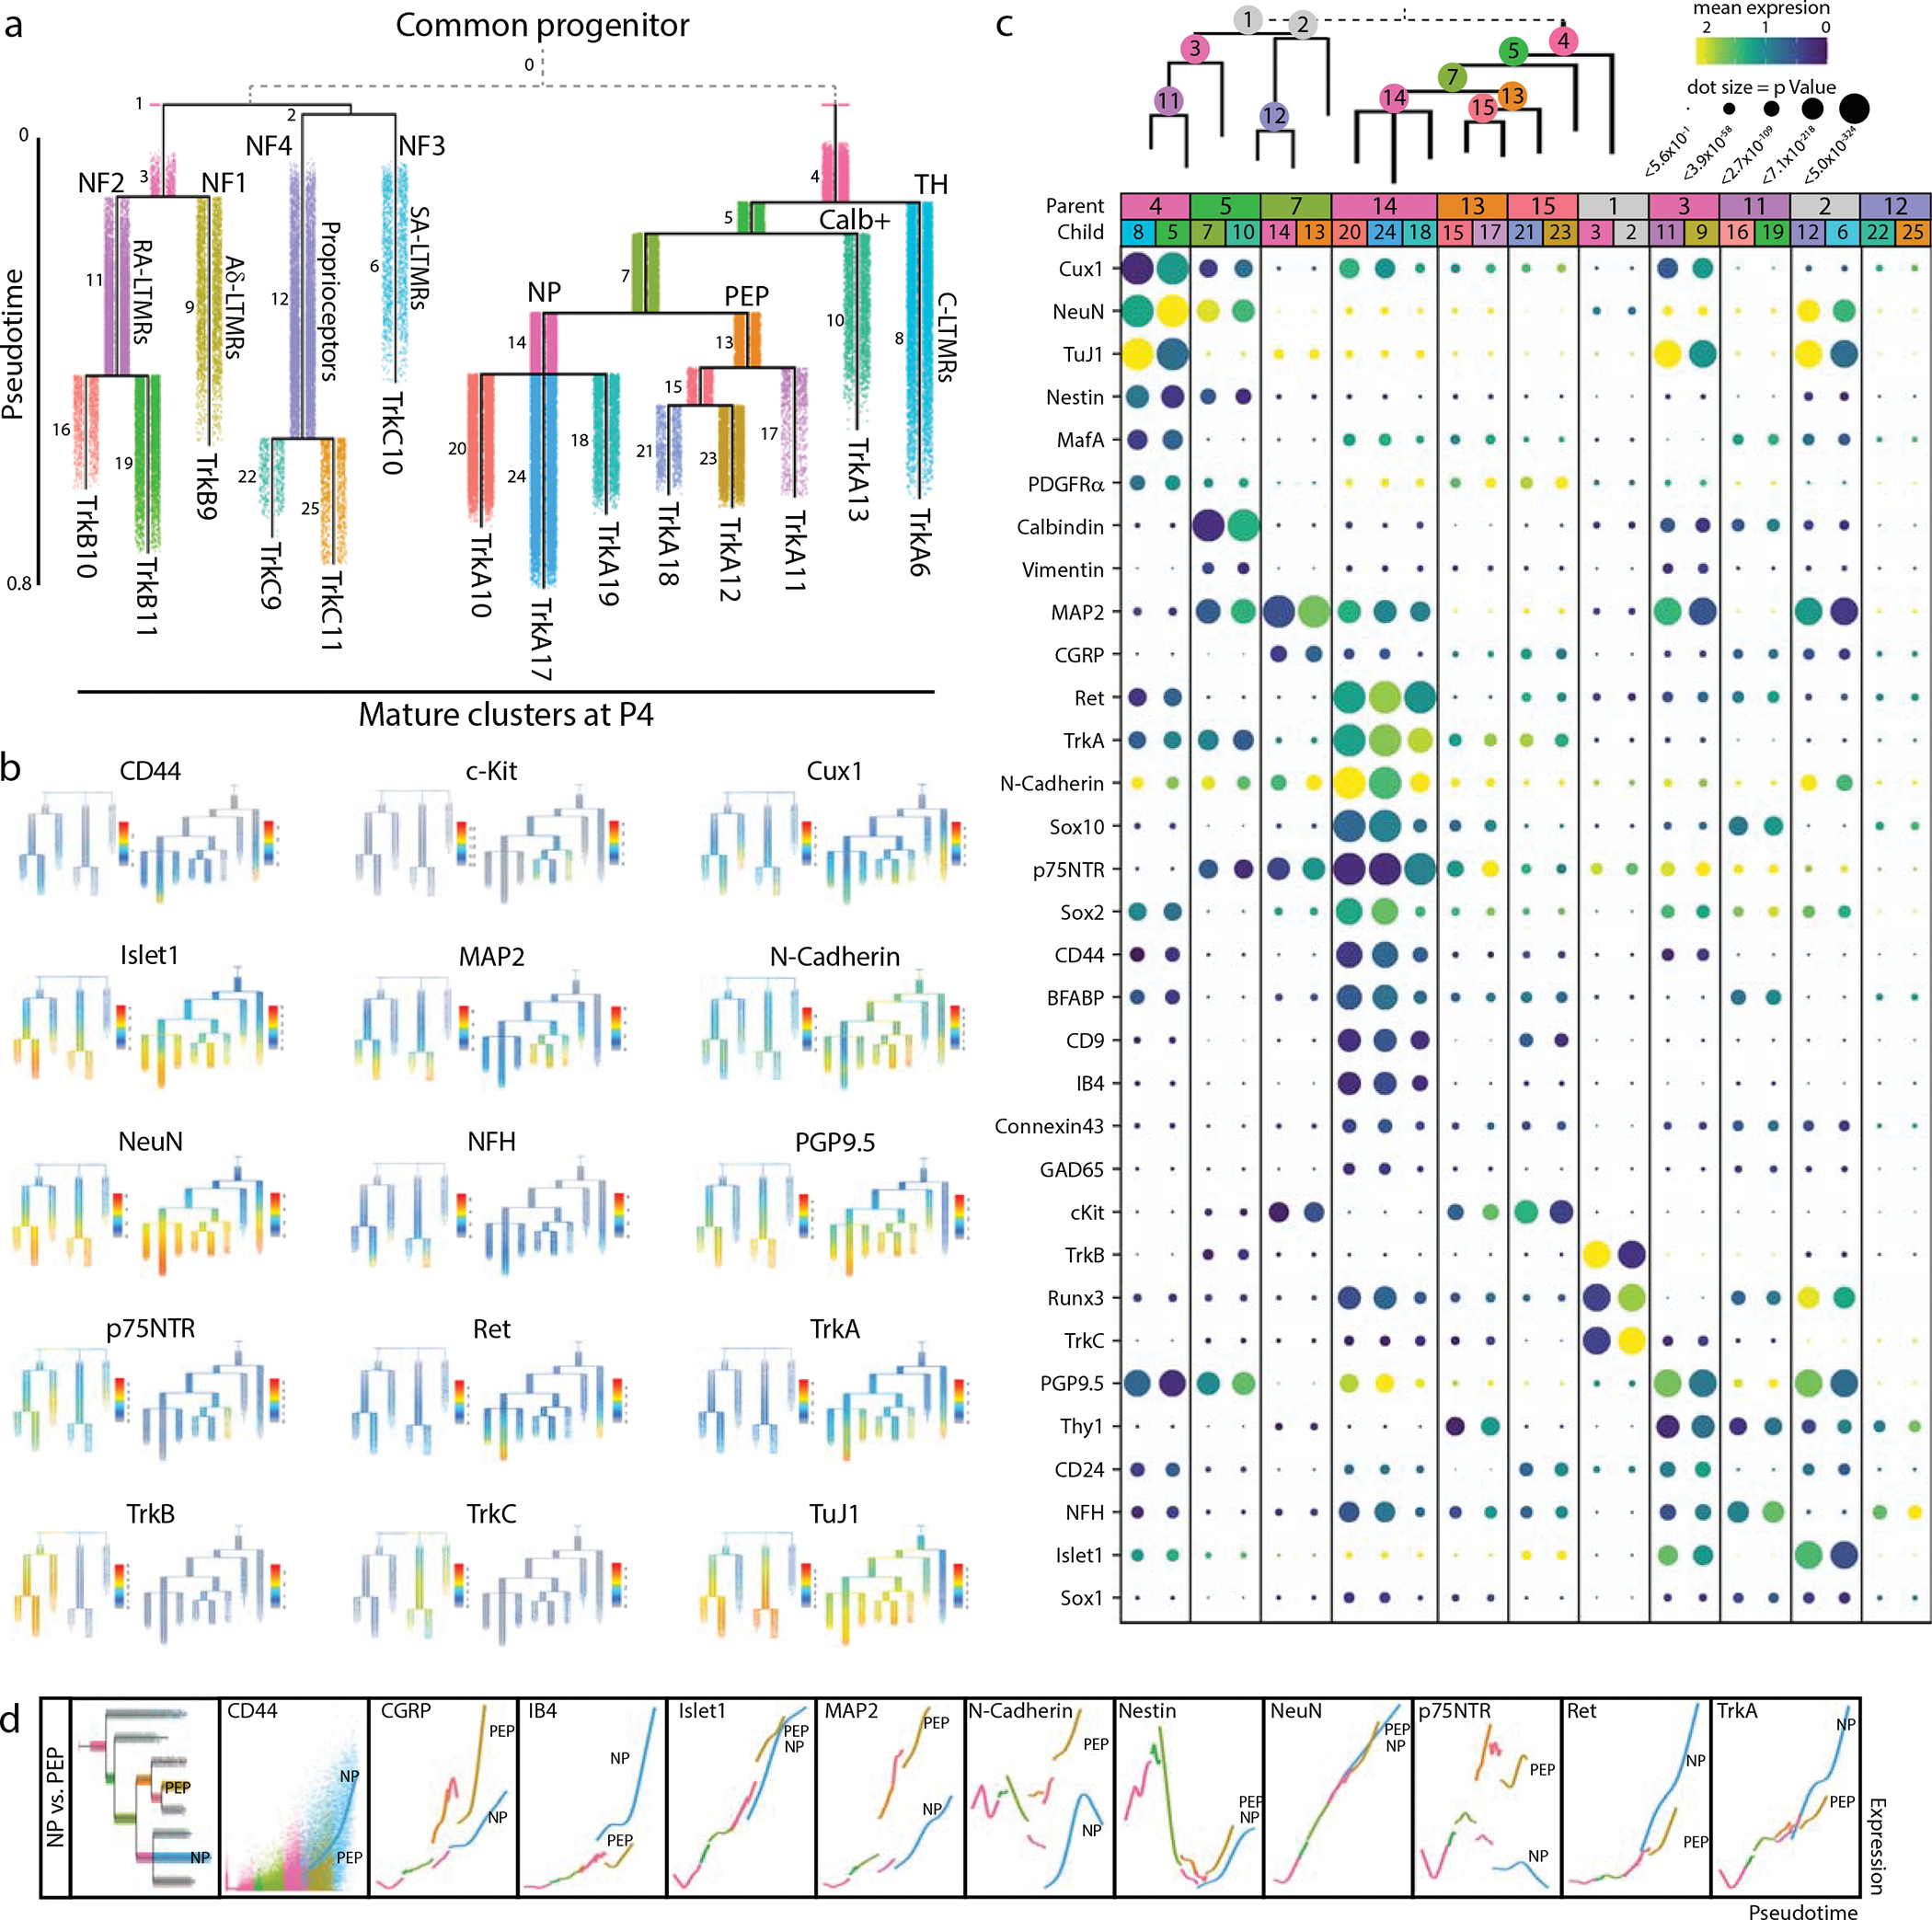
Fig. 5. Pseudotime analysis of neuronal differentiation.

a) URD pseudotime analysis of TrkB/TrkC neurons (39,944 cells) and TrkA/Ret neurons (64,997 cells downsampled from 493,544 total). These were run separately (gray dashed line), each with all E11.5 cells designated as root, and all mature P4 clusters designated as tips (Extended Data Fig. 8). Cells are colored by their dendrogram segment, which are numbered by median pseudotime, from youngest to oldest. Key cell fate bifurcations are labeled at branch points. b) URD dendrograms from (a) colored by protein expression for key markers of somatosensory neurons and subtypes. c) Proteins with the highest URD branch point divergence, ranked by p Value of the two-sample t-test between protein expression in the cell populations of each child segment. For branch points with more than two child segments, pairwise comparisons were made, and the most highly divergent p Value was used for rank ordering. Circle size indicates these p Values (log transformed) and circle color indicates marker expression in each child segment. d) Trajectory plots showing protein expression by pseudotime for nonpeptidergic and peptidergic nociceptors. Each URD segment (colored in the grayed URD in the top left box in e) is plotted with all cells from that segment overlaid with a smoothed spline (e.g. CD44). For clarity the dots representing the cells on both trajectories were removed from the subsequent markers.
