
Fig. 6. Elevated expression of stem cell and pro-growth markers in multi-Trk+ neurons.
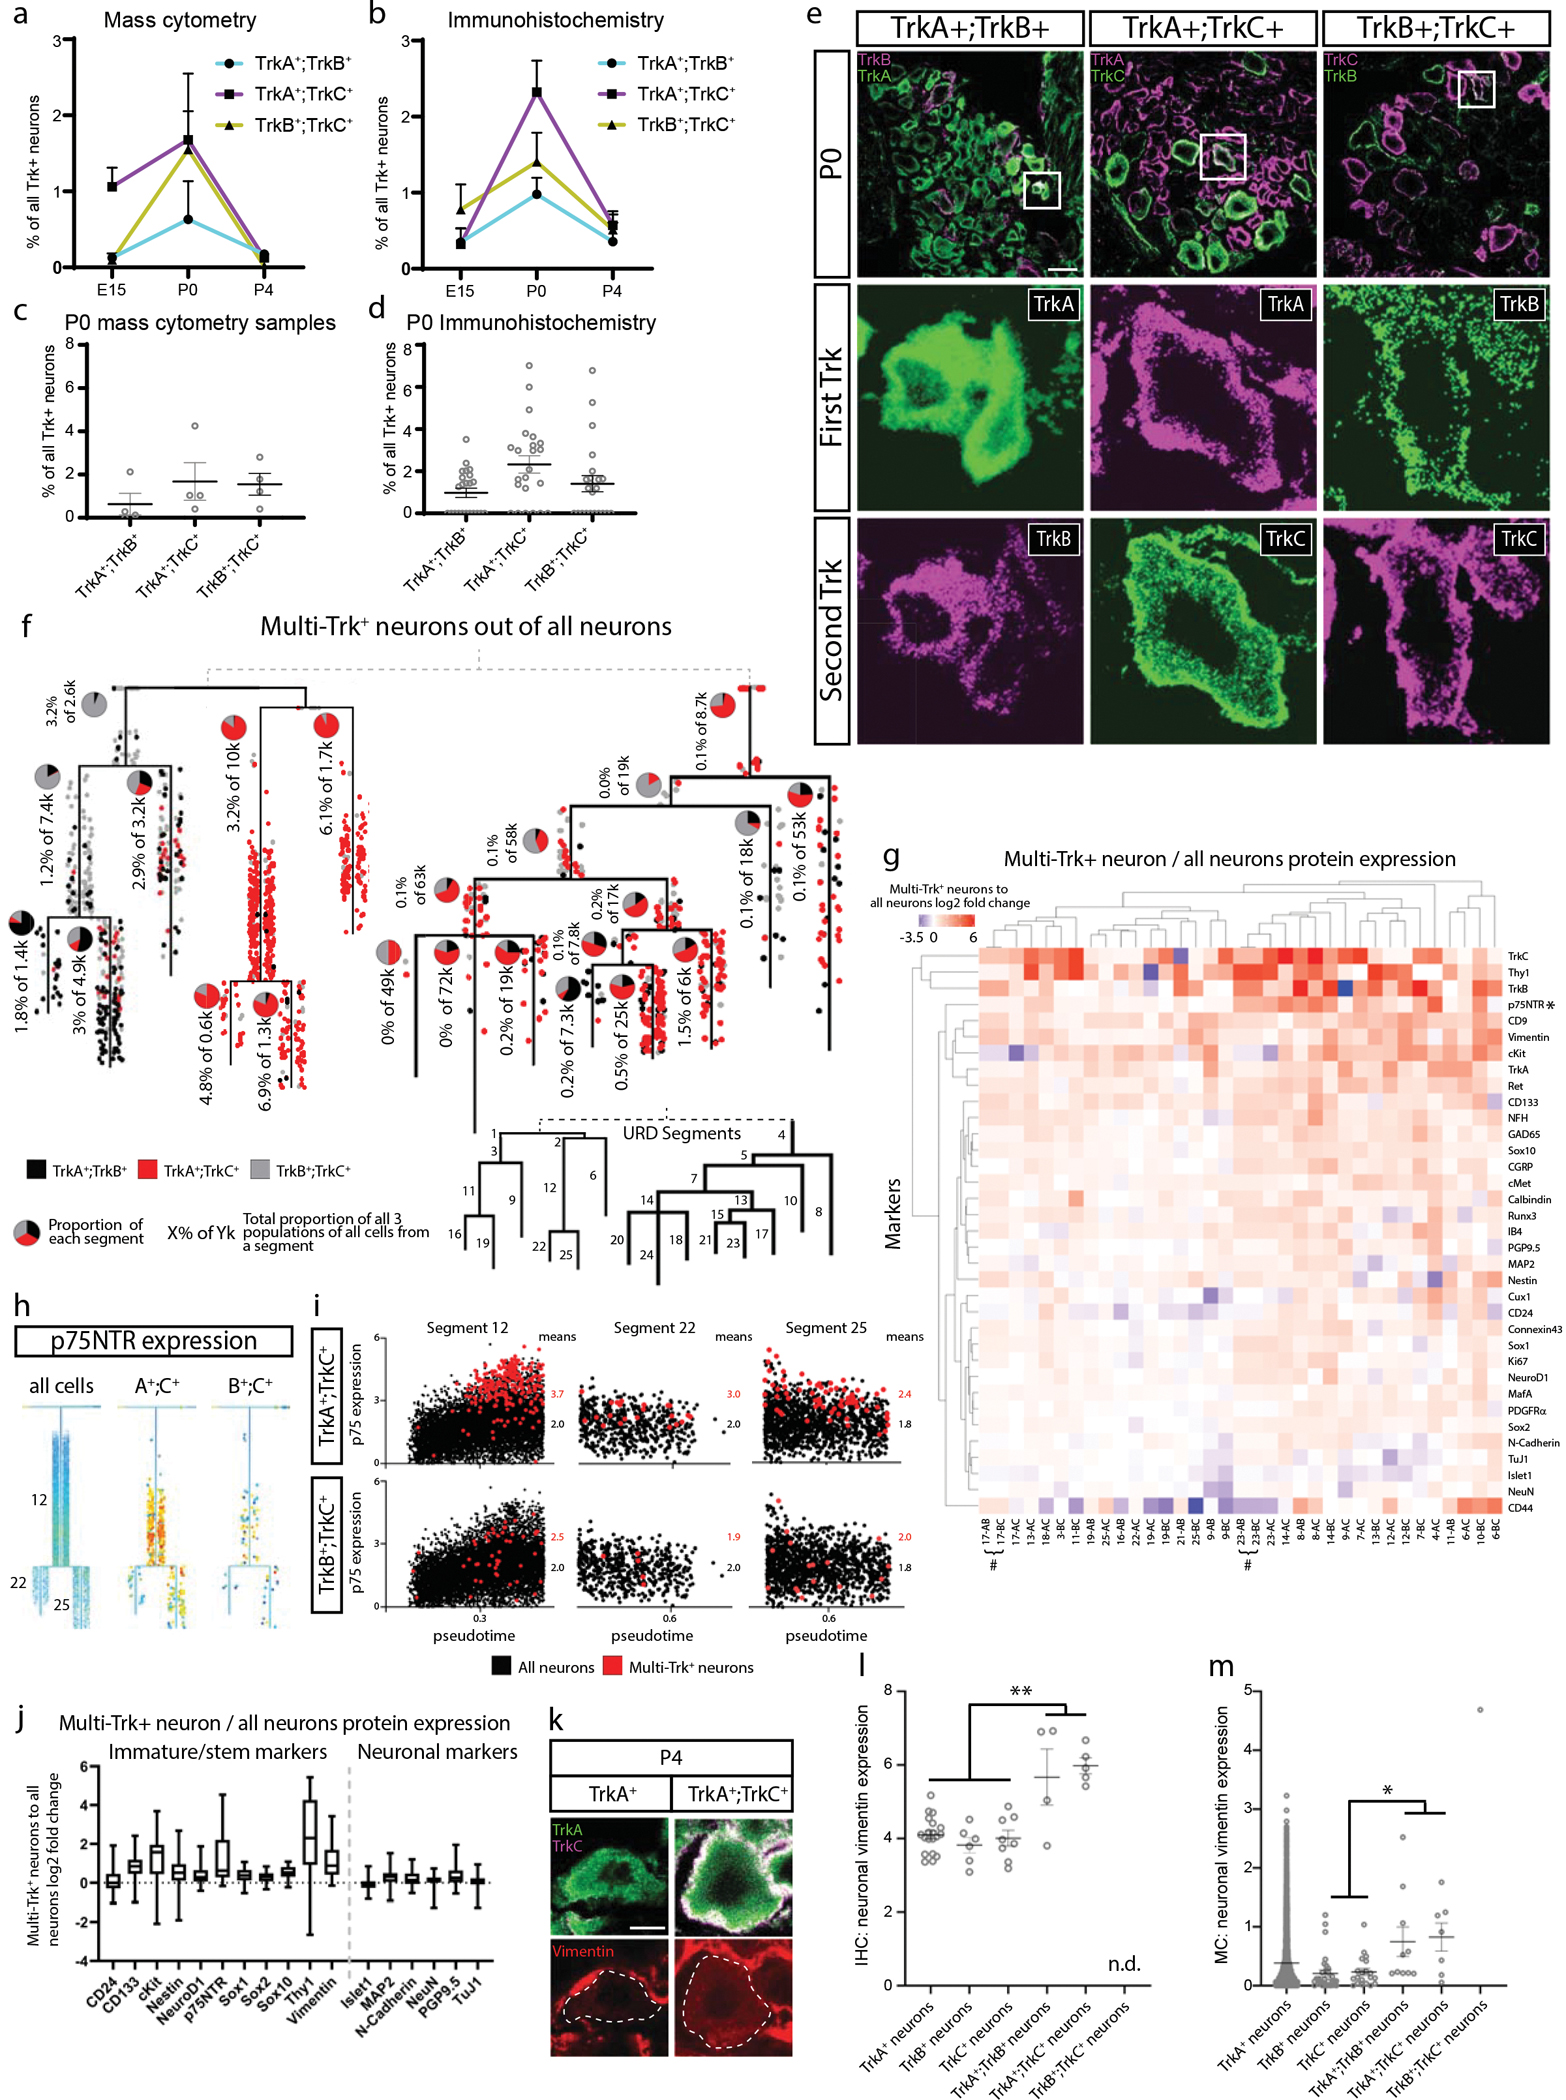
a) Proportion of multi-Trk+ neurons out of all Trk+ neurons (determined by thresholding expression values; TrkA>2, TrkB>3, and TrkC>2) at E15.5, P0, and P4 by mass cytometry. Data are presented as mean values +/− SEM with sample size as in Fig. 1g for the relevant age. b) Proportion of multi-Trk+ neurons out of all Trk+ neurons at E15.5, P0, and P4 by IHC of individual L4/L5 DRG cryosections. Data are presented as mean values +/− SEM with 3 litters with multiple DRGs analyzed per age for a total of 10, 23, and 14 DRGs at E15.5, P0, and P4, respectively. c) Relative proportion of each multi-Trk population in each P0 mass cytometry sample from (a). Data are presented as mean values +/− SEM with sample size as in Fig. 1g for only P0. d) Relative proportion of each multi-Trk population in individual L4/L5 DRG cryosections. Data are presented as mean values +/− SEM with 3 litters with 7–8 DRGs analyzed per litter, 23 DRGs in total. e) Representative IHC images of P0 L4/L5 DRGs with anti-TrkA, anti-TrkB, and anti-TrkC quantified in (b,d). Insets show a multi-Trk+ expressing neuron. Scale bar, 100 μm. f) All 1,480 multi-Trk+ neurons mapped onto the URD dendrogram from Fig. 5a by Nearest Neighbor URD Trajectory Tool (NNUTT) (Methods). In each segment, the relative proportions of each type of multi-Trk+ cells are indicated by pie charts, and the total proportion for all multi-Trk+ neurons relative to total neurons is indicated as a percentage. g) Log2 fold-change of protein expression in the multi-Trk+ neurons vs. total neurons in each URD dendrogram segment (Fig. 5a). Pound sign (#) denotes paired segments where all multi-Trk+ neurons were, in fact, tripleTrk+ neurons producing identical expression profiles in both segments. h) URD dendrograms of the proprioceptor population colored by p75NTR expression for the full dataset and two multi-Trk+ expressing neuron types. i) Every cell in segments 12, 22, and 25, respectively, plotted by pseudotime value and p75NTR expression. All neurons colored in black with the multi-Trk+ neurons are overlaid in red. j) Log2 fold change multi-Trk+ to all neuron comparison of marker expressions for immature/stem markers (left) and for neuronal markers (right) for all segments. Data are presented as mean values with the minimum value shown as the lower whisker, maximal value shown as the upper whisker, and the box bottom and top defines the first and third quartiles, respectively. Data are the marker expression comparisons for each URD segment, thus n=35. k) Representative immunohistochemistry of P4 L4/L5 DRG with anti-TrkA, anti-TrkC, and anti-vimentin. Dotted lines outline the indicated DRG neuron. Scale bar, 5μm. l) Quantification of vimentin immunohistochemical pixel intensity for single-Trk+ and multi-Trk+ neurons measured in FIJI. Three P4 litters with 3 L4/L5 DRGs (9 total) per litter were analyzed. Only 4 TrkA+;TrkB+ neurons, 5 TrkA+;TrkC+, and 0 TrkB+;TrkC+ neurons were detected in these DRGs. n.d. = “not detected”. Statistical analysis: one-way ANOVA using Tukey’s multiple comparison test and p Value **<0.005. Exact p Values are for all comparisons are in Extended Data Figure 9i. Data are presented as mean values +/− SEM. m) Quantification of vimentin expression from the mass cytometry dataset for single-Trk+ and multi-Trk+ neurons only from P4 samples. As in (a), multiTrk+ neurons were determined by thresholding expression values; TrkA>2, TrkB>3, and TrkC>2. Statistical analysis: one-way ANOVA using Tukey’s multiple comparison test and p Value *<0.05. Exact p Values are for all comparisons are in Extended Data Figure 9j. All neurons from P4 samples (n=2 biologically independent samples of pooled female and male litters) were included: 6034 TrkA+ neurons, 31 TrkB+ neurons, 20 TrkC+ neurons, 10 TrkA+;TrkB+ neurons, 7 TrkA+;TrkC+ neurons, and 1 TrkB+;TrkC+ neuron. Data are presented as mean values +/− SEM.