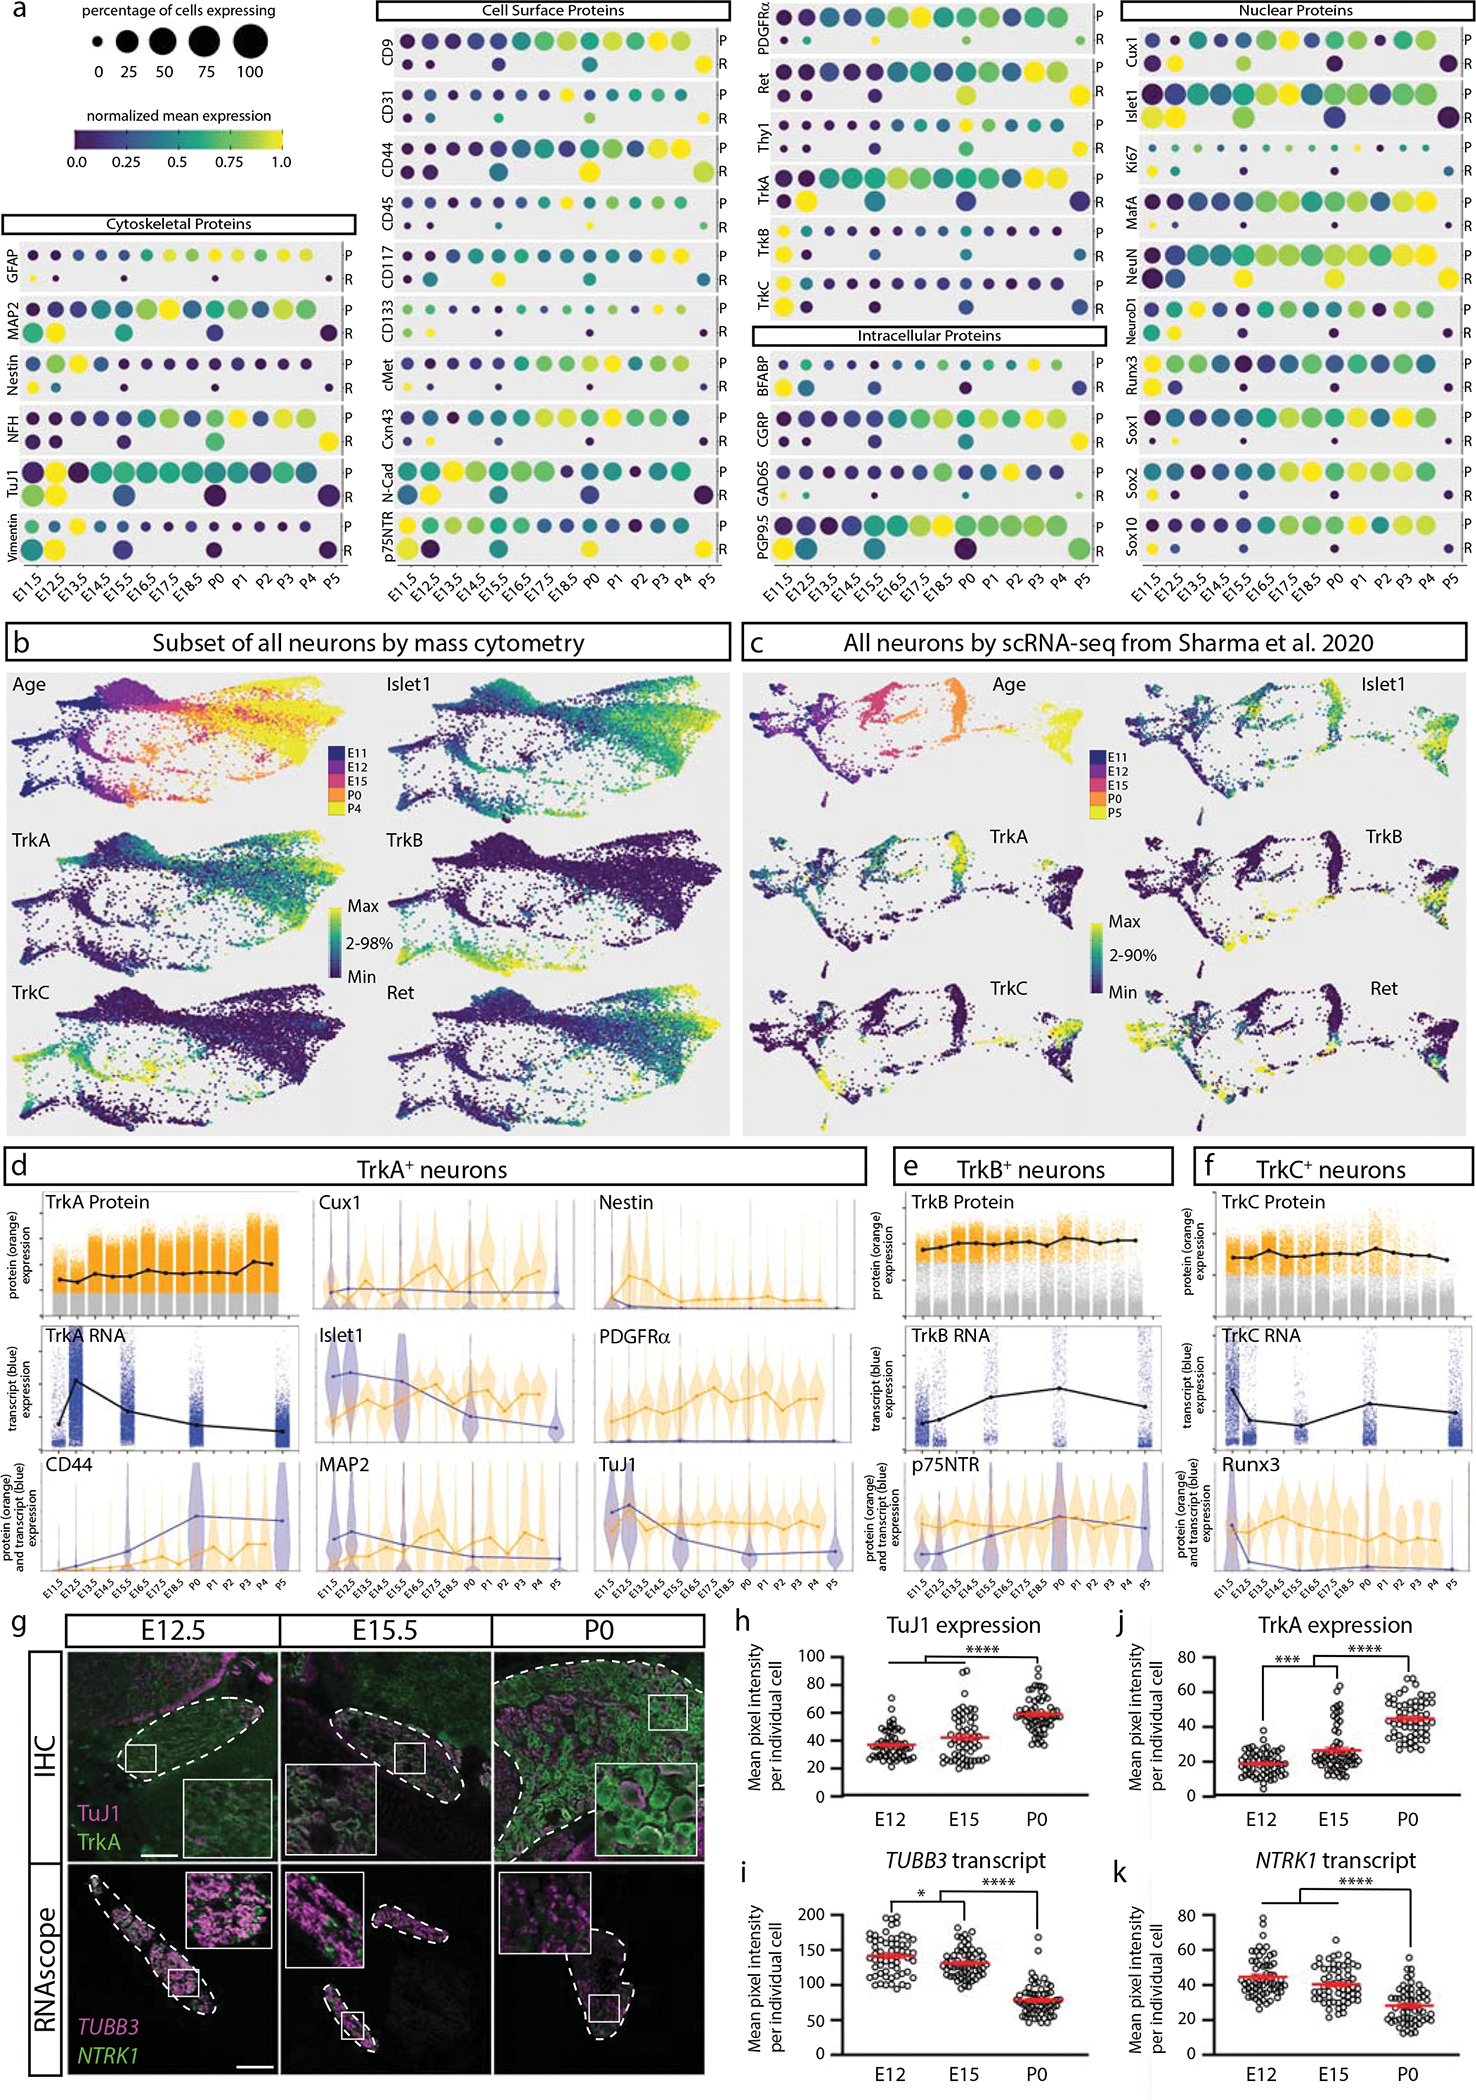
Fig. 7. Comparison of DRG analysis by mass cytometry and scRNA-seq.

a) Protein abundance measured by mass cytometry (E11.5 to P4) and mRNA transcript abundance measured by scRNA-seq (E11.5, E12.5, E15.5, P0, P5; Sharma et al., 202019). Circle size indicates the percentage of cells with expression above marker-specific thresholds. For mass cytometry, the threshold was set at greater than the 99th percentile expression level of low complexity cells. For scRNA-seq, the threshold was set at zero; all non-zero values were included. Circle color indicates mean intensity of expression within the positive-expressing cells. Protein/mRNA pairs are grouped by protein subcellular localization. P=protein (mass cytometry measurements) and R=mRNA (Sharma et al., 2020 scRNA-seq measurements19). b,c) FLOW-MAP layouts from (a) mass cytometry (25,000 cells downsampled from all neuronal cells, Fig. 4a–c), and (b) scRNA-seq (full 32,169 cell dataset19), colored by age and marker expression level. d-f) Comparison of protein and mRNA expression levels in TrkA+, TrkB+, or TrkC+ neurons. Positive-expressing cells for each RTK were separated from non-expressers (gray) by thresholding for mass cytometry (orange) and scRNA-seq (blue) as described above. Violin plot overlays compare the normalized protein and mRNA abundance in each Trk-expressing population. g) Comparison of immunohistochemistry and RNAscope for TuJ1/TUBB3 and TrkA/NTRK1 of L4/L5 DRG at E12.5, E15.5, and P0. IHC scale bar = 100μm and RNAscope scale bar = 200μm. h-k) Quantification of the IHC (h,j) and RNAscope (i,k) in (g) for TuJ1/TUBB3 and TrkA/NTRK1. Twenty cells from 1 or more DRGs per litter with 3 litters (60 total DRG neurons) were traced per age per technique and pixel intensity measured in FIJI for each marker. Statistical analysis: one-way ANOVA using Tukey’s multiple comparison test and p Values *<0.05, ***<0.001, and ****<0.0001. Exact p Values for (h) E12 v. E15 p=0.0745, E12 v. P0 p<0.0001, E15 v. P0 p<0.0001; (i) E12 v. E15 p=0.0492, E12 v. P0 p<0.0001, E15 v. P0 p<0.0001; (j) E12 v. E15 p=0.0003, E12 v. P0 p<0.0001, E15 v. P0 p<0.0001; (k) E12 v. E15 p=0.0794, E12 v. P0 p<0.0001, E15 v. P0 p<0.0001. Data are presented as mean values +/− SEM.
