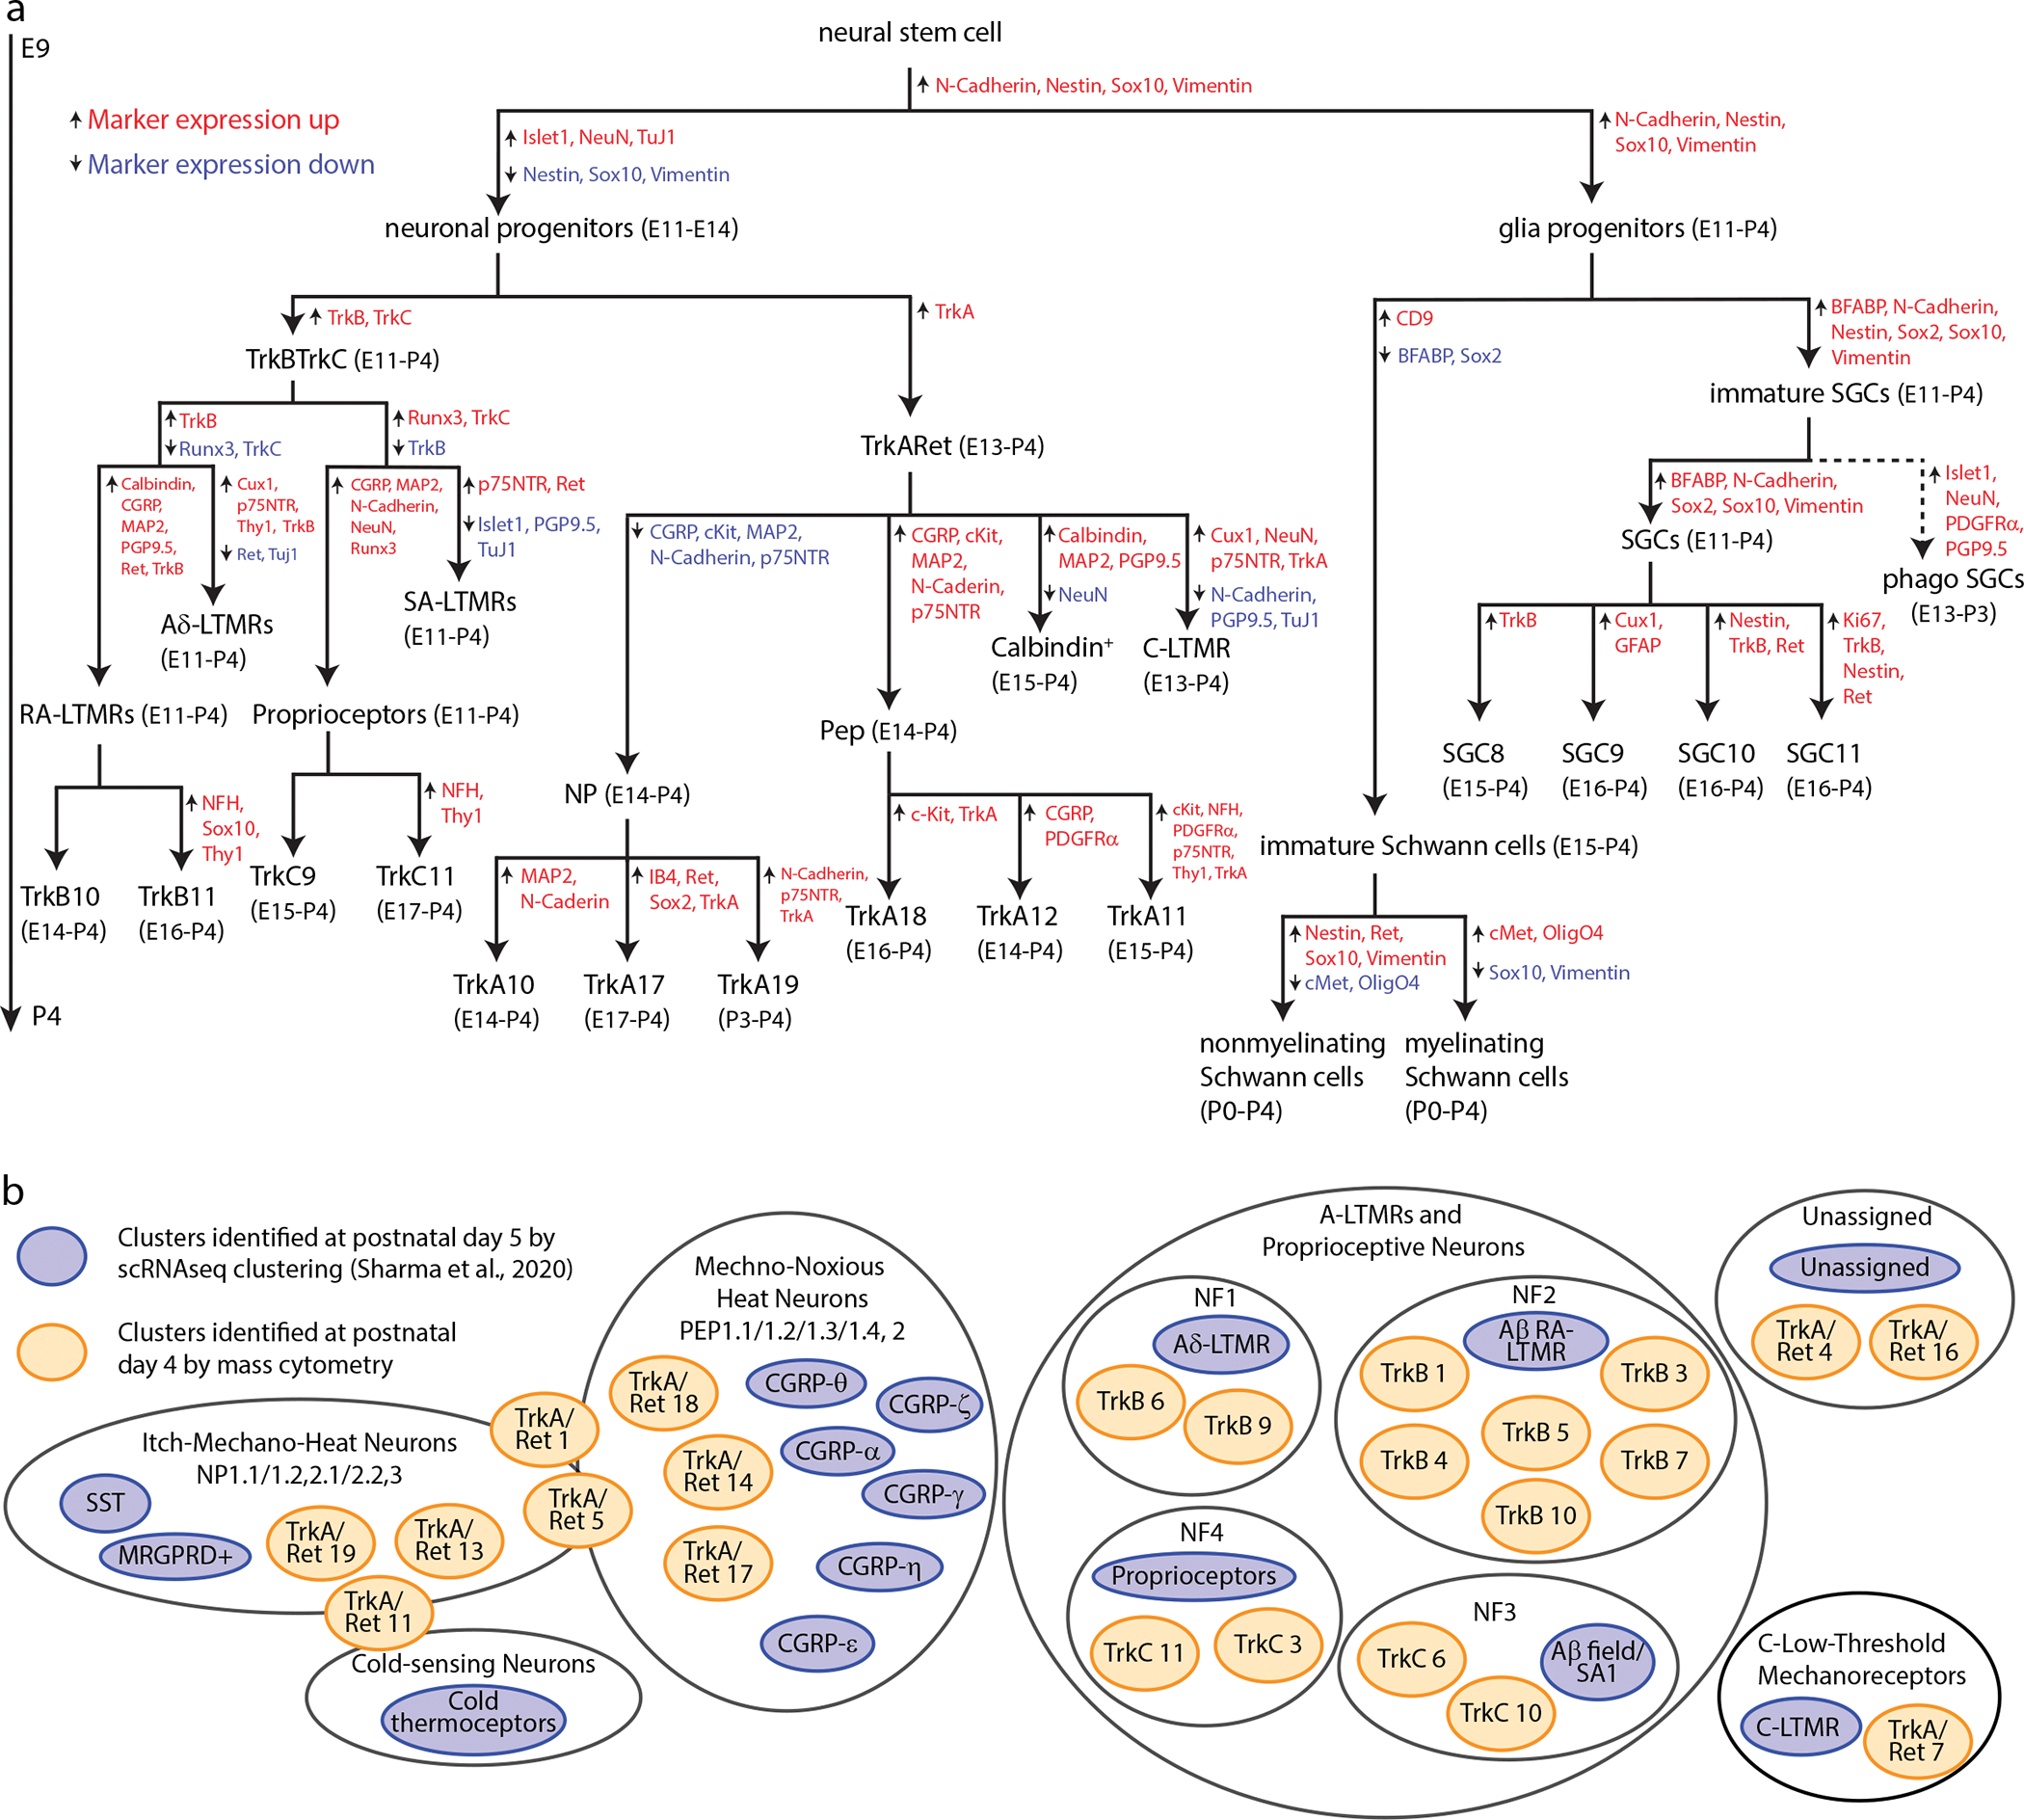
Fig. 8. Somatosensory maturation and development in the DRG.

a) Expression level overlap from analysis in Fig. 7 between the cell types identified by mass cytometry at P4 (orange) and scRNA-seq at P519 (blue). b) Summary diagram of DRG cell populations identified by mass cytometry analysis. Marker expression changes between segments are indicated by upward arrows with red text denoting marker expression increases and downward arrows with blue text denoting marker expression decreases. The age range where each population comprises at least 1% of that cell type (e.g. a neuronal cell type is at least 1% of all neurons, not all cells) is indicated beside each population label.
