
Extended Data Fig. 1. Validation of antibodies for mass cytometry.
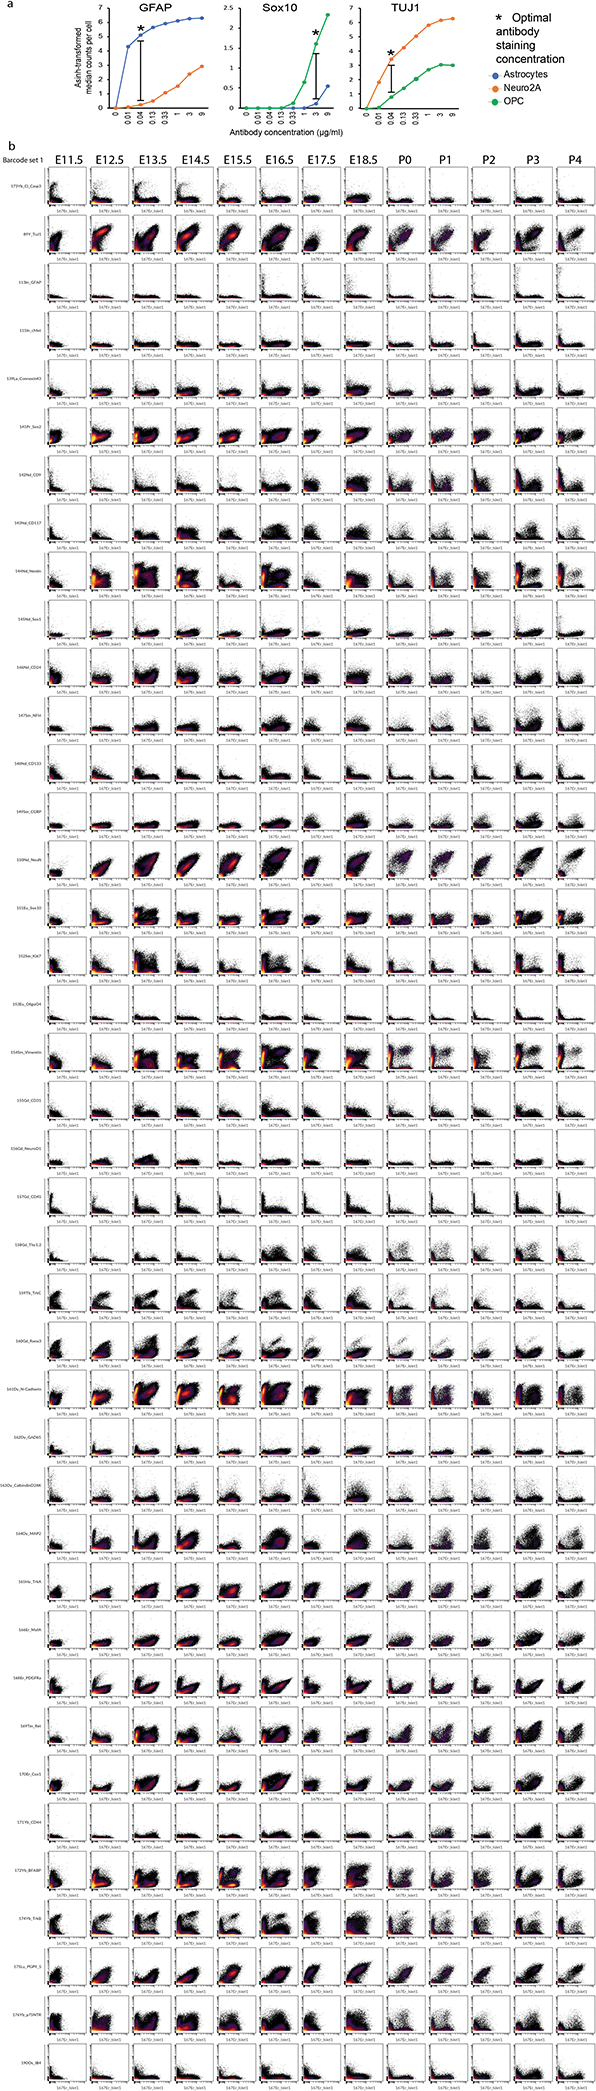
All antibodies validated and included in the DRG mass cytometry antibody panel. a) Each antibody was titrated across a range of concentrations (e.g. 9μg/ml to 0.01μg/ml). Known-positive and known-negative control cell samples were tailored for each antibody. Sometimes these were separate samples, and sometimes the known-positive and known-negative cells coexisted in a single sample, distinguishable by a separate antibody counterstain. Optimal staining concentrations for each antibody were determined by identifying the largest difference in signal intensity between known-positive and known-negative cells. b) Biaxials scatterplots for each antibody except for anti-Islet1 (y-axis) in the panel at each age by Islet1 (x-axis), demonstrating positive and negative staining across the DRG developmental time course. Samples were selected from Set 1. For postnatal ages the female sample from Set 1 was used. Full data available in Data Availability.