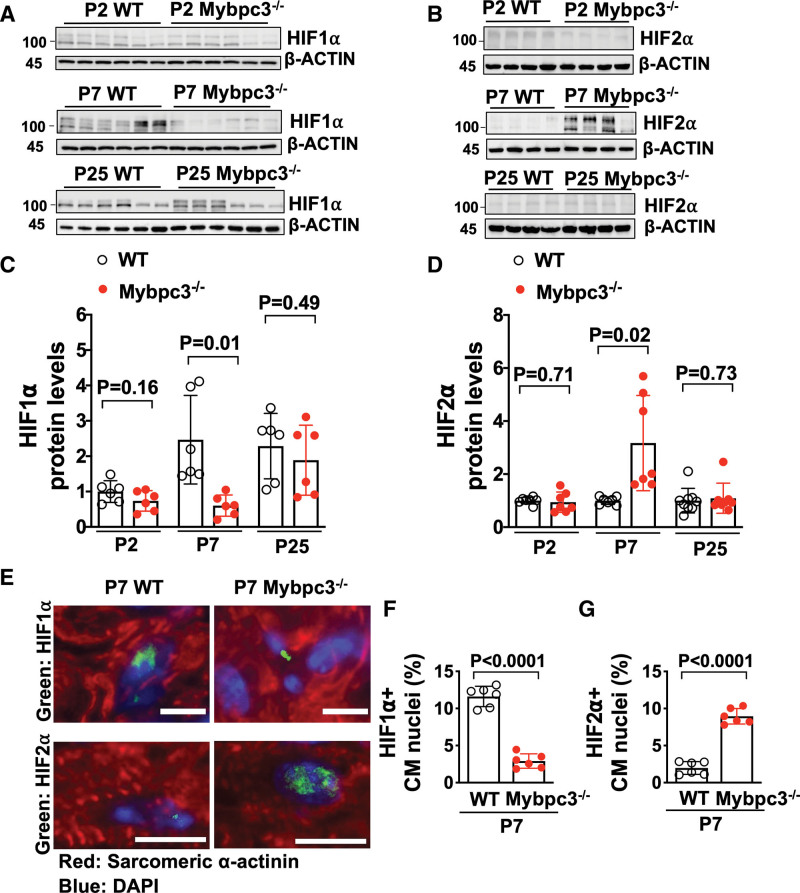
Figure 2.
Dynamic changes in HIF1α and HIF2α occur during the early postnatal period in the Mybpc3-/- myocardium. Immunoblots for HIF1α (A) and HIF2α (B) in left ventricular tissue lysates from WT and Mybpc3−/− mice at postnatal day 2 (P2), postnatal day 7 (P7), or postnatal day 25 (P25). C, HIF1α protein quantification from WT (n=6) and Mybpc3−/− (n=6) left ventricular tissue lysates from P2, P7, or P25 mice normalized to β-actin protein expression and relative to postnatal day 2 WT mice. D, HIF2α protein quantification from WT (n=7–9) and Mybpc3−/− (n=7–8) left ventricular tissue from postnatal days 2, 7, or 25 mice normalized to β-actin and relative to postnatal day 2 WT mice. E, Representative immunohistochemistry images for HIF1α (top; green) and HIF2α (bottom; green) costained with sarcomeric α-actinin (red), in left ventricular tissue from postnatal day 7 WT and Mybpc3−/− mice. Nuclei are blue (DAPI); scale bars=5 um (HIF1) or 10 μm (HIF2). F, HIF1α-positive CM nuclei (% of total nuclei) in left ventricular tissue from postnatal day 7 WT (n=6) and Mybpc3−/− (n=6) mice. Minimum 100 nuclei per sample. G, HIF2α-positive CM nuclei (% of total nuclei) in left ventricular tissue from postnatal day 7 WT (n=6) and Mybpc3−/− (n=6) mice. Minimum 100 nuclei per sample. All results are shown as mean±SEM; Student or Welch t test were used for C, D, F, and G. CM indicates cardiomyocyte; DAPI, 4′,6-diamidino-2-phenylindole; HIF1α, hypoxia-inducible factor 1 alpha; HIF2α, hypoxia-inducible factor 2 alpha; Mybpc3-/-, cardiac myosin binding protein 3 homozygous deletion; and WT, wild-type.

