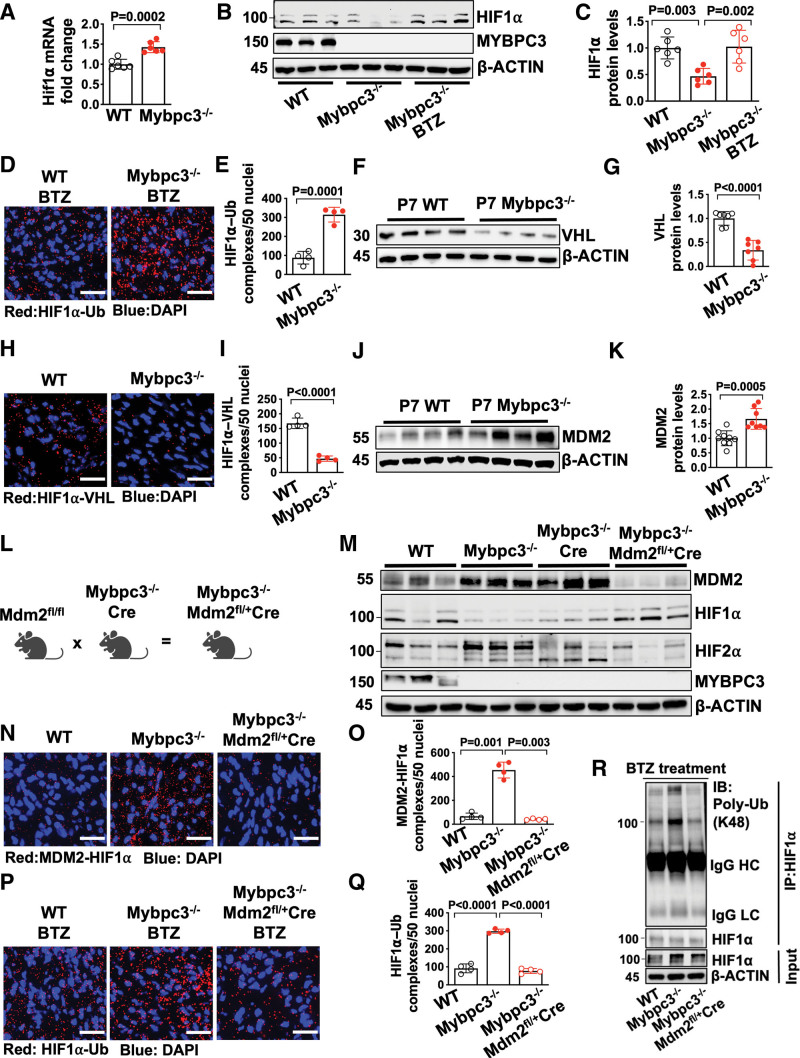
Figure 3.
The noncanonical degradation of HIF1α in the Mybpc3-/- myocardium is regulated by cardiomyocyte MDM2. A, Hif1α gene expression in left ventricular tissue RNA from postnatal day 7 (P7) WT (n=6) and Mybpc3−/− (n=6) mice. Hif1α gene expression was normalized to Rpl32 and fold change relative to WT. B and C, Immunoblots and protein quantification for HIF1α in left ventricular tissue lysates from P7 WT (n=6), Mybpc3−/− (n=6), and BTZ-injected Mybpc3−/− (n=6) mice normalized to β-actin and relative to WT. D and E, Representative in situ proximity ligation assay images and quantification for Ub-modified HIF1α in left ventricular tissue from BTZ injected P7 WT (n=4) and Mybpc3−/− (n=4) mice. HIF1α–Ub complexes are red and nuclei are blue (DAPI). Three nonoverlapping left ventricular images per sample; scale bars=25 μm. F and G, Immunoblot and quantification for VHL in left ventricular tissue lysate from P7 WT (n=7) and Mybpc3−/− (n=7) mice normalized to beta-actin and relative to WT. H and I, Representative in situ proximity ligation assay images and quantification for HIF1α and VHL protein complexes in left ventricular tissue from P7 WT (n=4) and Mybpc3−/− (n=4) mice. HIF1α–VHL complexes are shown in red and nuclei are blue (DAPI); 3 nonoverlapping left ventricular images per sample; scale bars=25 μm. J and K, Immunoblot and quantification for MDM2 in left ventricular tissue from P7 WT (n=9) and Mybpc3−/− (n=8) mice normalized to β-actin and relative to WT. L, Schematic of cardiomyocyte selective reduction of MDM2 in Mybpc3-/- mice generated by crossing Mdm2fl/fl, Mybpc3-/-, and Myh6:Cre mouse lines to create Mybpc3−/−Mdm2fl/+/Myh6:Cre. M, Immunoblot for MDM2, HIF1α, HIF2α, MYPBC3, and β-actin in left ventricular tissue from P7 WT, Mybpc3−/−, Mybpc3-/-/Myh6:Cre, and Mybpc3−/−Mdm2fl/+/Myh6:Cre mice. N and O, Representative in situ proximity ligation assay images and quantification for MDM2 and HIF1α protein complexes in left ventricular tissue from P7 WT (n=4), Mybpc3−/− (n=4), and Mybpc3−/−Mdm2fl/+/Myh6:Cre (n=4) mice. MDM2–HIF1α complexes are shown in red and nuclei are blue (DAPI). Three nonoverlapping left ventricular images per sample; scale bars=25 μm. P and Q, Representative in situ proximity ligation assay images and quantification for Ub-modified HIF1α in left ventricular tissue from BTZ-injected P7 WT (n=4), Mybpc3−/− (n=4), and Mybpc3−/−Mdm2fl/+/Myh6:Cre (n=4) mice. HIF1α–Ub complexes are red and nuclei are blue (DAPI). Three nonoverlapping left ventricular images per sample; scale bars=25 μm. R, Immunoprecipitation (IP) for HIF1α was performed on left ventricular tissue lysates from BTZ-injected P7 WT, Mybpc3−/− and Mybpc3−/−Mdm2fl/+/Myh6:Cre mice and then immunoblots were performed for K48-linked Ub and HIF1α. The input left ventricular tissue lysates also underwent immunoblotting for HIF1α and β-actin. All results are shown as mean±SEM. Student t test was used for A, E, G, I, and K; 1-way ANOVA with Tukey or Dunnett T3 multiple comparison test were used for C, O, and Q. BTZ indicates bortezomib; DAPI, 4′,6-diamidino-2-phenylindole; HC, heavy chain; HIF1α, hypoxia-inducible factor 1 alpha; HIF2α, hypoxia-inducible factor 2 alpha; IB, immunoblot; LC, light chain; MDM2, murine double minute 2; Mdm2fl/+, Mdm2 heterozygous floxed; Mybpc3-/-, cardiac myosin binding protein 3 homozygous deletion; Myh6:Cre, myosin heavy chain 6:Cre recombinase; Poly-Ub, K48-linked ubiquitin; Rpl32; ribosomal protein L32; Ub, Ubiquitin; VHL, Von Hippel-Lindau; and WT, wild-type.

