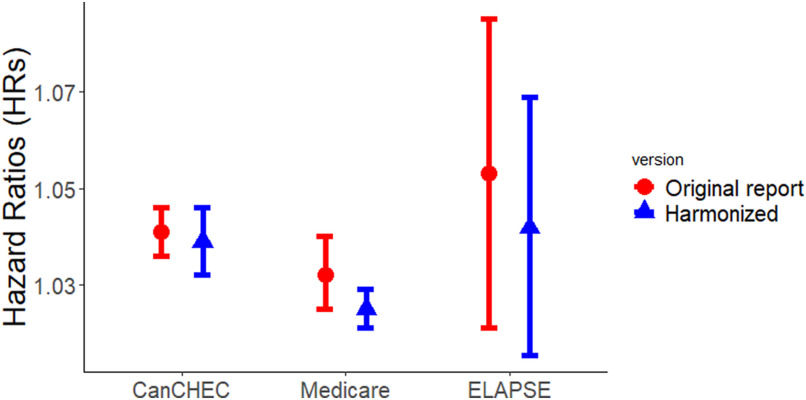
Figure 2.
Associations between exposure (per ) and mortality in the harmonized analyses and the original reports. Numeric effect estimates derived from the current harmonized analyses are shown in Table 2. Hazard ratios and 95% CIs associated with a increase in exposure were 1.041 (1.036, 1.046) for the stacked CanCHEC (1991–2016), 1.032 (1.025, 1.040) for Medicare (2000–2016), and 1.058 (1.022, 1.095) for the six ELAPSE cohorts (Belgian, 2001–2011; Danish, 2000–2015; Dutch, 2008–2012; Norwegian, 2001–2016; Roman, 2001–2015; Swiss, 2001–2014) in the respective original reports.3–5 HRs in the original reports were associated with different ages, exposure models applied, statistical analyses, and mortality definitions. Note: CanCHEC, Canadian Census Health and Environment Cohorts; CI, confidence interval; ELAPSE, Effects of Low-Level Air Pollution: A Study in Europe; HR, hazard ratio; , particulate matter with aerodynamic diameter .

