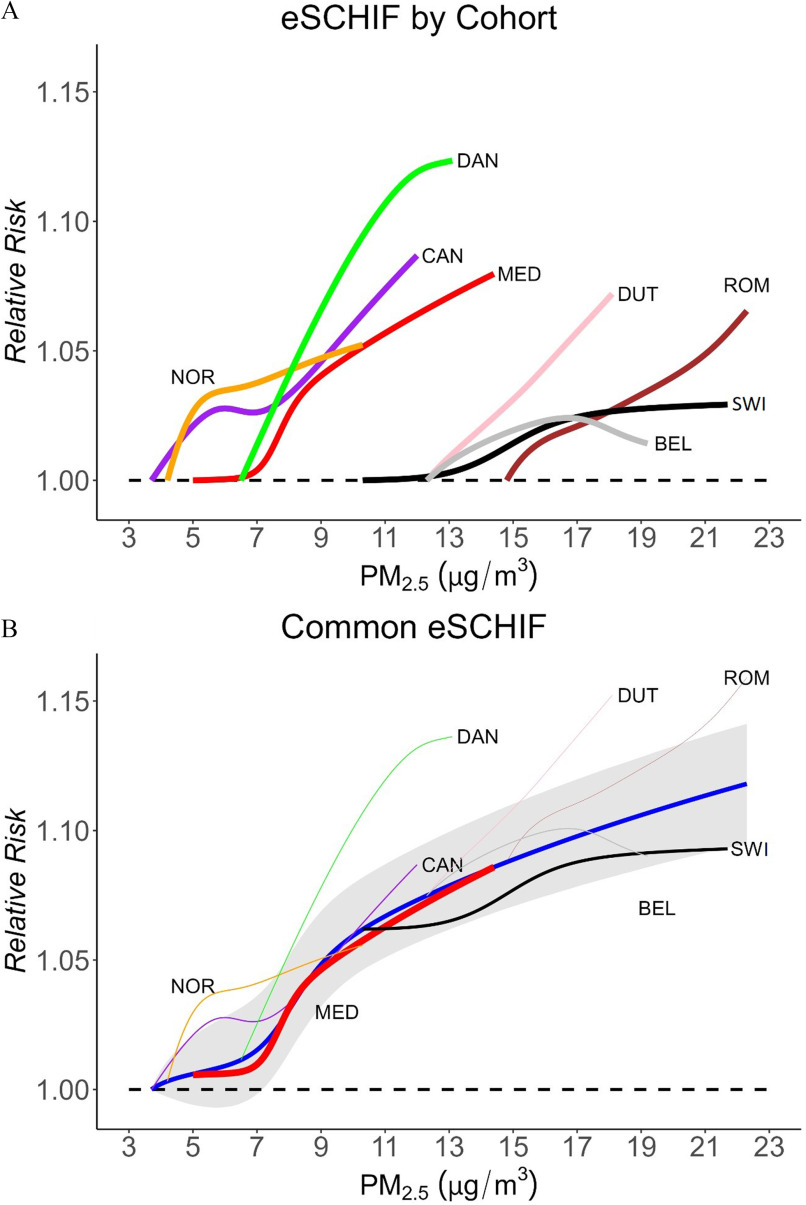
Figure 3.
CRF for exposure and all-cause mortality in population years of age. (A) Mean of eSCHIF fits in eight individual cohorts with counterfactual levels equal to the fifth percentile of the cohort-specific exposure distributions (corresponding values specified in Table 1). (B) Common eSCHIF (blue solid line) and confidence interval (shaded area) combined by meta-analysis. In panel B, all curves share the common counterfactual level represented by the lowest fifth percentile of the cohort-specific exposure distributions across all cohorts (i.e., counterfactual level set to ). Each cohort only contributed information over its concentration range. The thickness of the individual lines indicated the weights each cohort contributed to in the meta-analysis: Medicare (0.444), Swiss (0.213), CanCHEC (0.084), Norway (0.080), Belgian (0.067), Danish (0.049), Dutch (0.045), Rome (0.017). Note: BEL, Belgian (2001–2011); CAN, CanCHEC (1991–2016); CanCHEC, Canadian Census Health and Environment Cohorts; CI, confidence interval; CRF, concentration-response function; DAN, Danish (2000–2015); DUT, Dutch (2008–2012); ELAPSE, Effects of Low-Level Air Pollution: A Study in Europe; eSCHIF, extended shape-constrained health impact function; HR, hazard ratio; MED, Medicare (2000–2016); NOR, Norwegian (2001–2016); , particulate matter with aerodynamic diameter ; ROM, Roman (2001–2015); SWI, Swiss (2001–2014).

