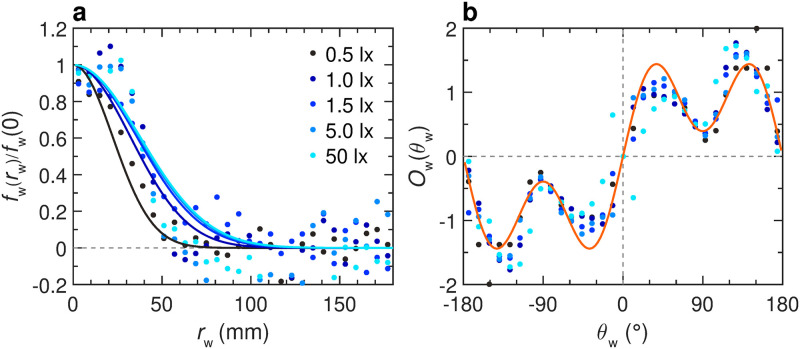
Fig 4. Effects of light intensity on the fish interactions with the tank wall.
Function of repulsion fw(rw)Ow(θw) as extracted from the experiments by means of the reconstruction procedure, for different light intensities: 0.5, 1, 1.5, 5, and 50 lx (from dark to light blue). a Intensity fw(rw) of the interaction as a function of the fish distance to the wall rw. For the 5 considered light intensities, the PDF of rw (see Fig 3) has only a small residual weight of 8.1%, 4.2%, 3.6%, 1.8%, 1.3% for rw > 80 mm, respectively, which explains the large fluctuations of fw(rw) observed for rw > 80 mm. b Intensity Ow(θw) of the interaction as a function of the relative orientation of the fish to the wall θw. Color dots correspond to the discrete values resulting from the reconstruction procedure, extracted from the experimental data. Blue solid lines correspond to the analytical approximation of the discrete functions for the corresponding light condition. The orange line corresponds to the analytical approximation of a single discrete function combining all light conditions: Ow(θw) = 1.9612 sin(θw)[1 + 0.8 cos(2θw)].

