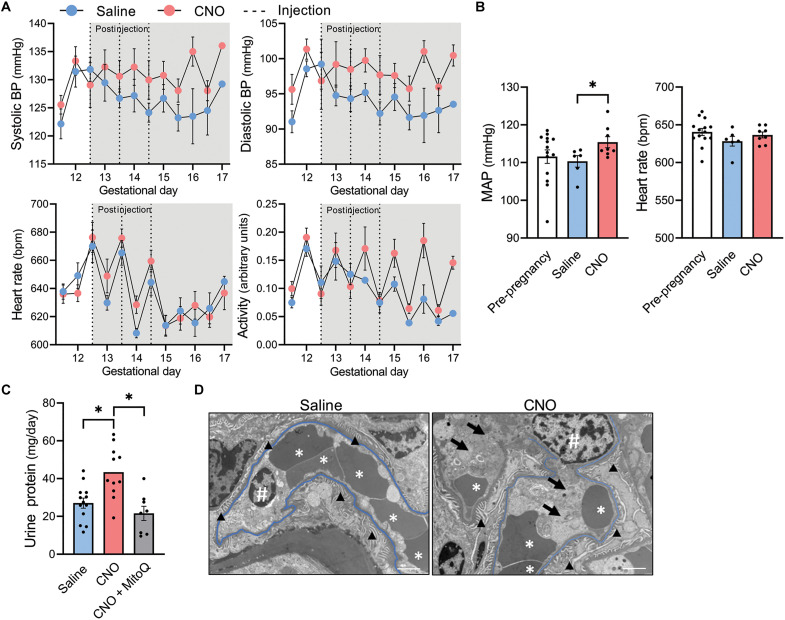
Fig. 6. Maternal effects of syncytiotrophoblast-restricted Gαq activation (hM3DqF/F dam x Gcm1-Cre+/− sire).
(A) Average daily systolic blood pressure, diastolic blood pressure, heart rate, and activity separated by light and dark cycles. Dotted lines indicate time of CNO or saline administration (to GD 16.5: saline n = 6, CNO n = 8; to GD 17: saline n = 1, CNO n = 4). (B) Average 24-hour heart rate and mean arterial pressure (MAP) from GD 13 to 16.5 (postinjection period). (C) Twenty-four–hour urine protein excretion at GD 14.5. (D) Transmission electron micrographs of renal capillary loops at GD 14.5 indicating slight endothelial swelling in CNO mice (arrows) and slight congestion in both groups (* denotes red blood cells). Capillary basement membranes are highlighted in blue. Symbol “#” represents endothelial cell nuclei. Arrowheads identify podocyte foot processes. Scale bars, 2 μm; *P < 0.05, independent samples t test (two-tailed) or one-way ANOVA with Bonferroni multiple comparisons procedure. Datapoints for (B) and (C) represent biological replicates. BP, blood pressure.

