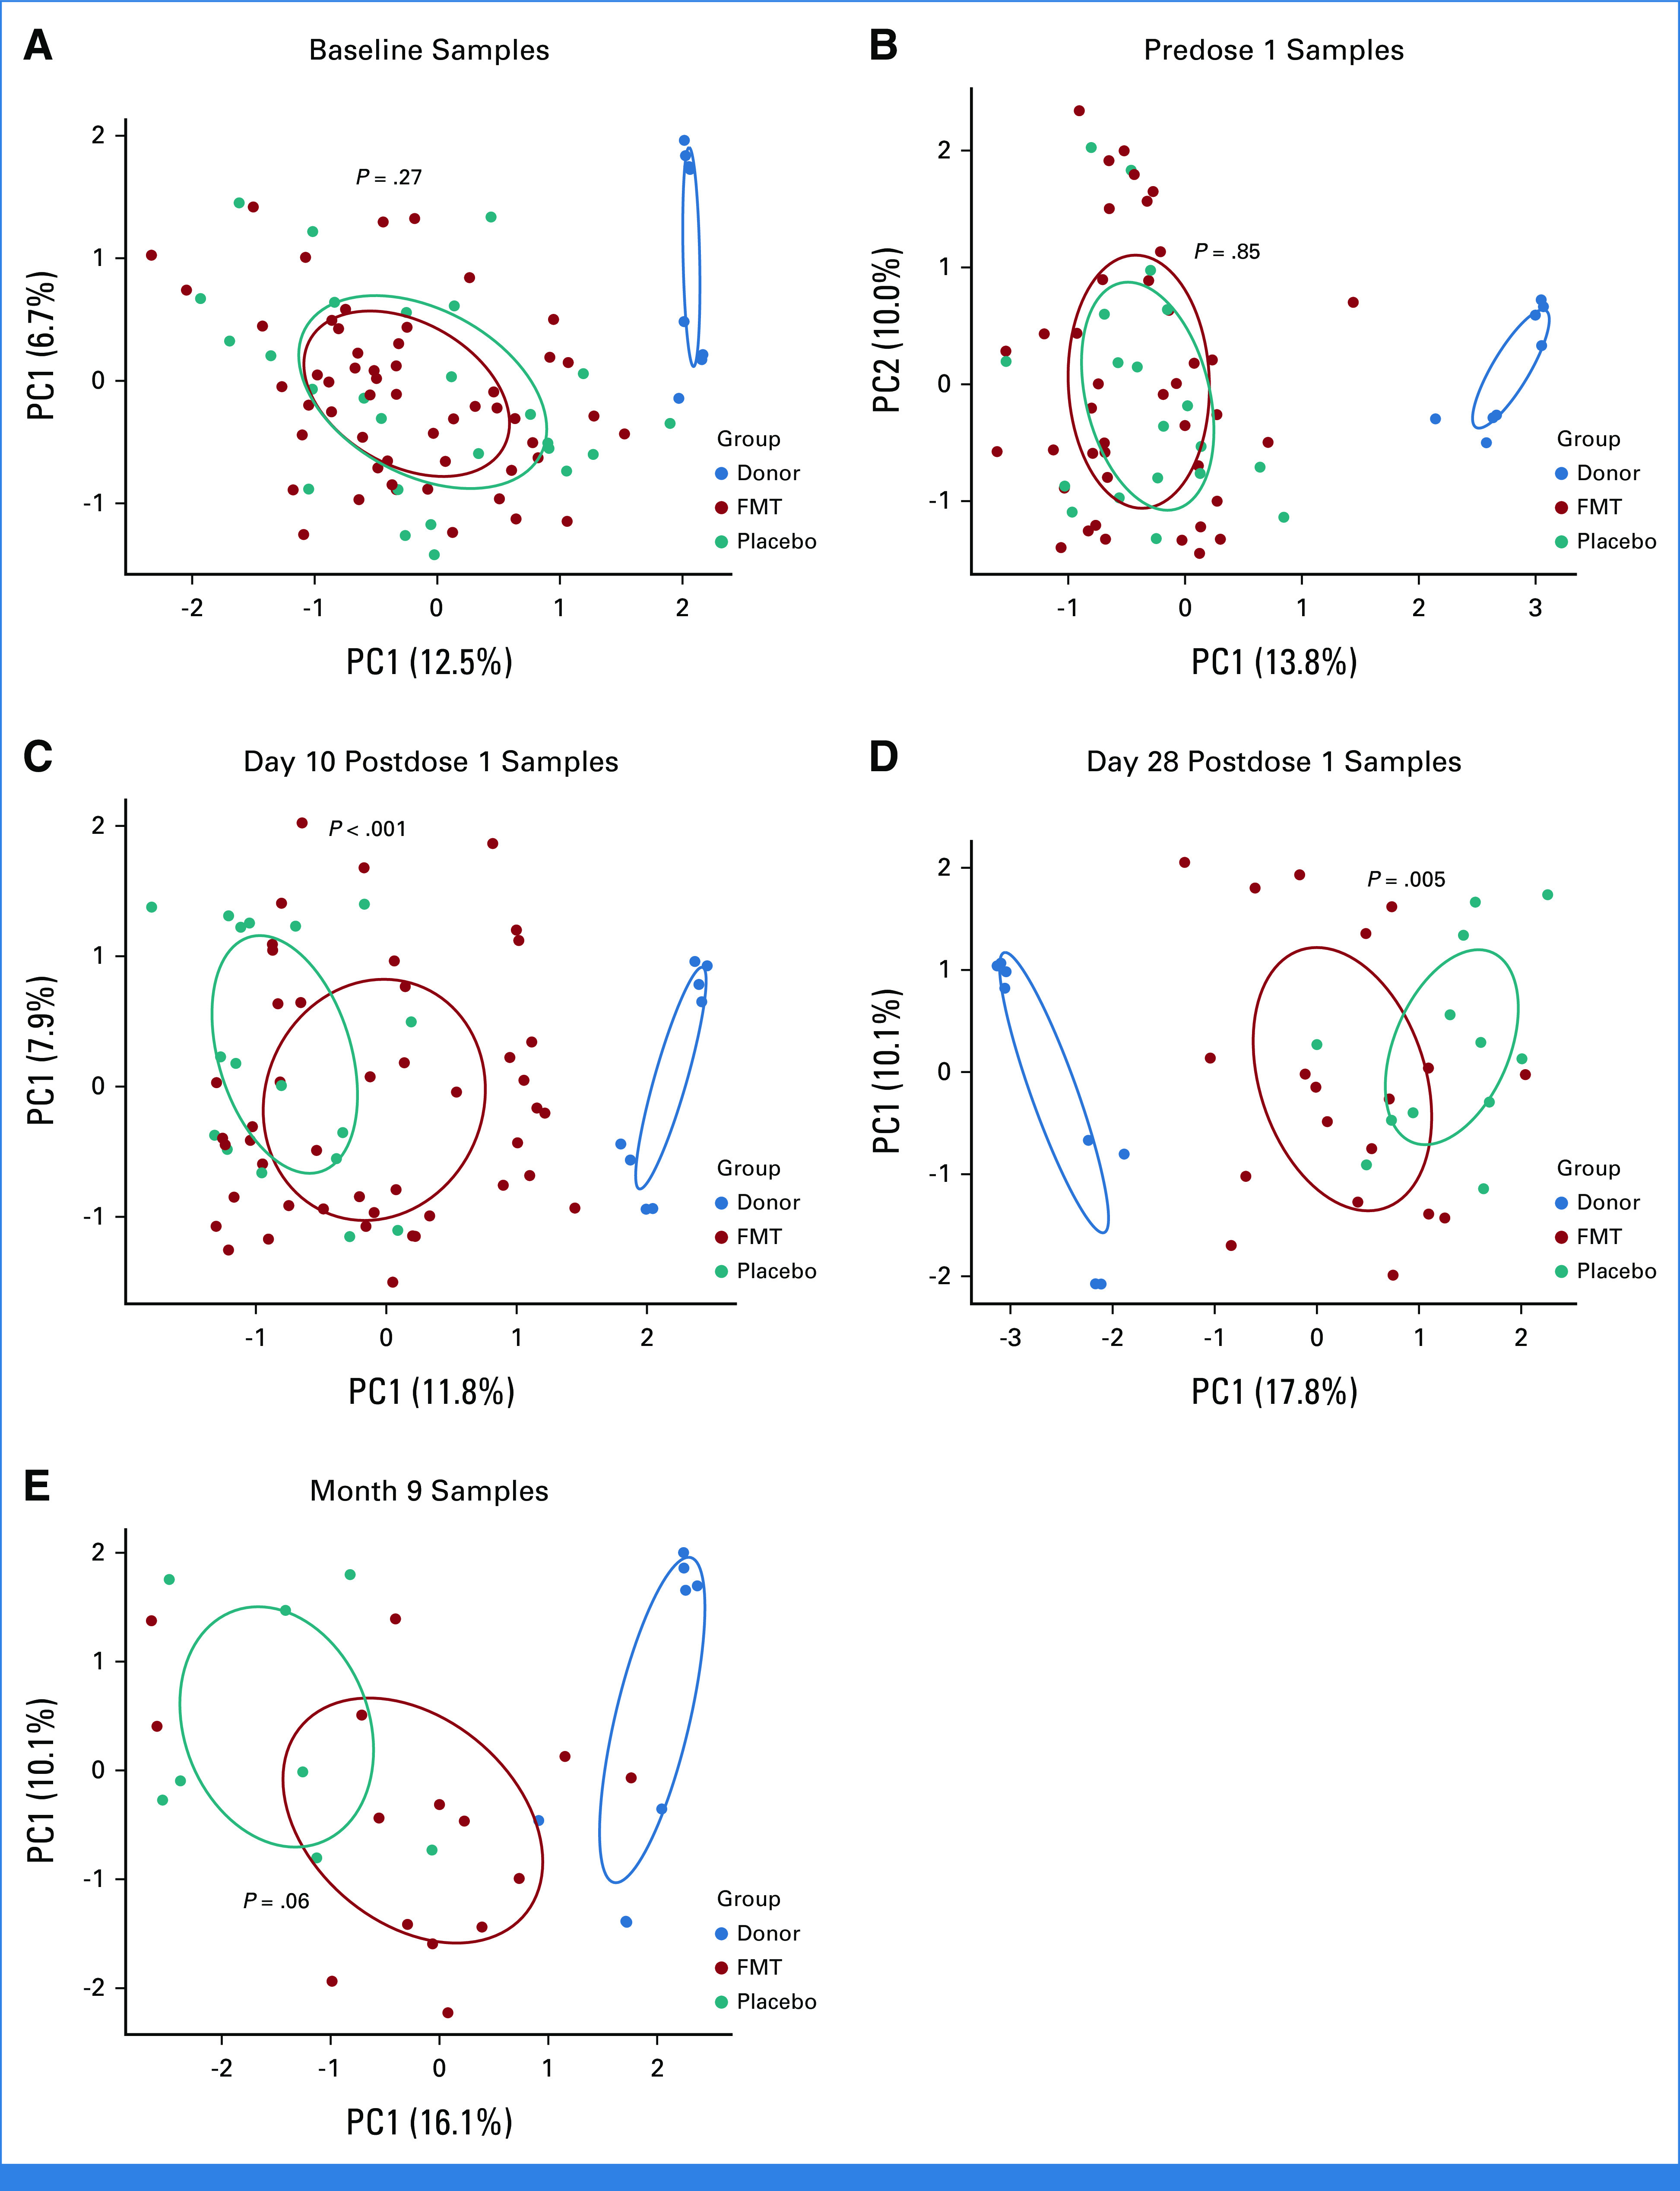
FIG 3.

Microbiota clustering per treatment arm at each time point. (A) Baseline, (B) predose 1, (C) day 10 postdose 1, (D) day 28 postdose 1, and (E) month 9. Principal component analysis using Aitchison distances, with numbers in parentheses indicating the proportion of variation explained by the corresponding axis. Each point is a fecal sample and samples with similar microbiome composition are closer together in the plot. 95% confidence ellipses for group centroids are shown. P values are from an adonis test with 999 permutations and compare samples in FMT versus placebo arms. FMT, fecal microbiota transplantation; PC, principal component.
