. 2023 Dec 1;12:RP87022. doi: 10.7554/eLife.87022

Figure 2. Behavioral results.

(A) Signal detection theoretic sensitivity (d’), separately per drug and cue validity. Error bars indicate SEM, x demarks the p-value for the omnibus interaction effect between drug condition and cue validity, val. refers to the factor cue validity. (B) As A, but for reaction time (RT). (C) Schematic of the drift diffusion model (DDM), accounting for behavioral performance and RTs. The model describes behavior based on various latent parameters, including drift rate (v), boundary separation (a), and non-decision time (t0). These parameters (demarked with Y in formula) were allowed to fluctuate with cue validity, drug condition, and their interaction. Models were fitted separately for atomoxetine (ATX) (+placebo [PLC]) and donepezil (DNP) (+PLC). (D–E) Posterior probability distributions for DDM parameter estimates (blue: ATX model, green: DNP model). The effects of cue validity (left column), drug (middle column), and their interaction (right column) are shown for (D) drift rate and (E) non-decision time.

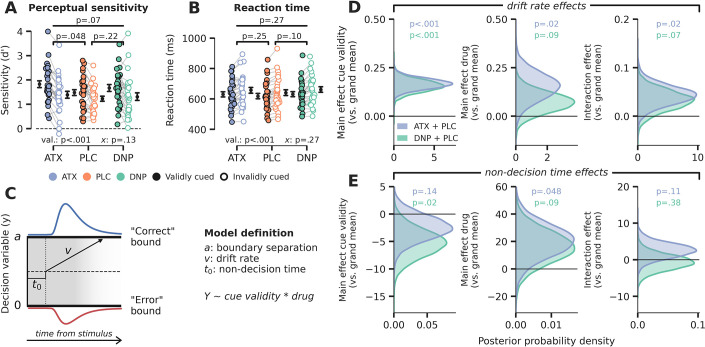
Figure 2—source data 1. Source files for behavioral data and computational analyses.

Figure 2.

Figure 2—figure supplement 1. Cue validity and drug condition effects on (choice history) bias.

Figure 2—figure supplement 1.

(A) Signal detection theory (SDT) criterion was not modulated by cue validity (F1,27=2.89, p=0.10, ηp2 = 0.10) or drug (F2,54=2.31, p=0.11, ηp2 = 0.08), nor was there a modulatory effect of drug on the effects of cue validity (F2,54=2.01, p=0.14, ηp2 = 0.07). (B) Absolute SDT criterion was minimized for validly cued trials, suggesting that participants were more biased (either liberal or conservative) when they did not attend the target stimulus (F1,27=11.05, p=0.003, ηp2 = 0.29). There were no drug condition main effects (F2,54=0.25, p=0.78, ηp2 = 0.01) and interaction effects (F2,54=0.29, p=0.75, ηp2 = 0.01). (C) Participants pressed the right button more often during invalidly cued trials (F1,27=5.79, p=0.02, ηp2 = 0.18), possibly related to defaulting back to their preferred hand (right-handedness), but there was no main effect of drug condition (F2,54=1.19, p=0.31, ηp2 = 0.04) nor an interaction between cue validity and drug (F2,54=1.02, p=0.37, ηp2 = 0.04). (D) We did not observe any effects of drug condition (F2,54=0.46, p=0.63, ηp2 = 0.02), cue validity (F1,27=0.17, p=0.69, ηp2 = 0.01), or their interaction (F2,54=1.14, p=0.33, ηp2 = 0.04) on choice history bias. Note that x demarks the omnibus interaction between drug condition and cue validity. Val. (short for validity) refers to the factor cue validity.
Figure 2—figure supplement 1—source data 1. Source files for behavioral data.
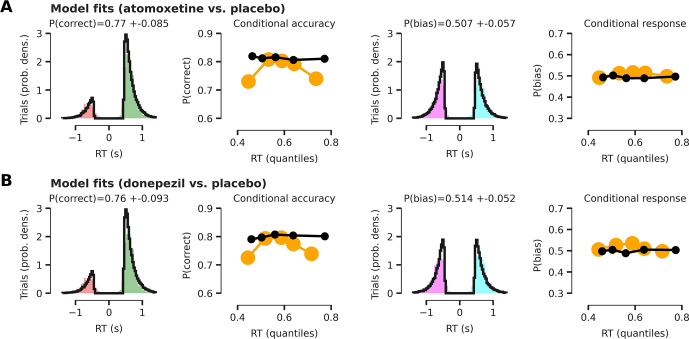
Figure 2—figure supplement 2. HDDM model fits.

Figure 2—figure supplement 2.

All model fits are shown with respect to the empirical data after collapsing across conditions (cue validity and drug). Note that our modeling approach renders the drift diffusion model (DDM) fits complicated to interpret, as the intercept of the effect-coded regression implementation of the DDM reflects a grand mean across conditions. Therefore, model fits show how well empirical data fits the model across all experimental conditions. (A) Model fits for the atomoxetine (vs. placebo) model. Left panel shows reaction time (RT) fits (black lines) for incorrect and correct responses. Empirical RTs for correct responses are shown in green, for erroneous responses in red. The second panel (from the left) shows modeled proportion correct (black dots) within 5 quantiles of modeled RTs, compared to empirical proportion correct responses (yellow dots) within 5 quantiles of empirical RTs. Right two panels are similar to left two, but show RT distributions for left (turquoise) vs. right (purple) button responses and the proportion of right button responses within each RT bin. (B) Same as panel (A), but for the donepezil (vs. placebo) model. The first quintile seems relatively poorly fitted. This is because the model was fitted after excluding outlier RTs (5% of data; Materials and methods; Wiecki et al., 2013), which are typically very short-latency errors. Thus, these outlier RTs have an effect on the first empirical quintile (yellow), but not on synthetic data generated by the fitted model (black).
Figure 2—figure supplement 2—source data 1. Source files for drift diffusion model (DDM) fits.
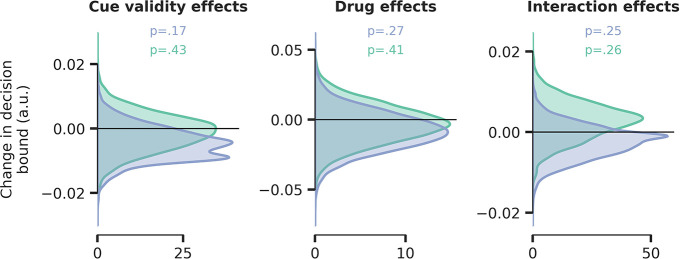
Figure 2—figure supplement 3. No effects of cue validity, drug, and their interaction on decision bound separation in weighted regression drift diffusion model (DDM).

Figure 2—figure supplement 3.

The computational model described in the main text allowed drift rate, non-decision time, and decision bound separation to fluctuate with drug and cue validity. There were no effects of cue validity and drug on decision boundary separation. Blue distribution = atomoxetine (ATX) model, green distribution = donepezil (DNP) model.
Figure 2—figure supplement 3—source data 1. Source files for drift diffusion model (DDM) model bound estimates.
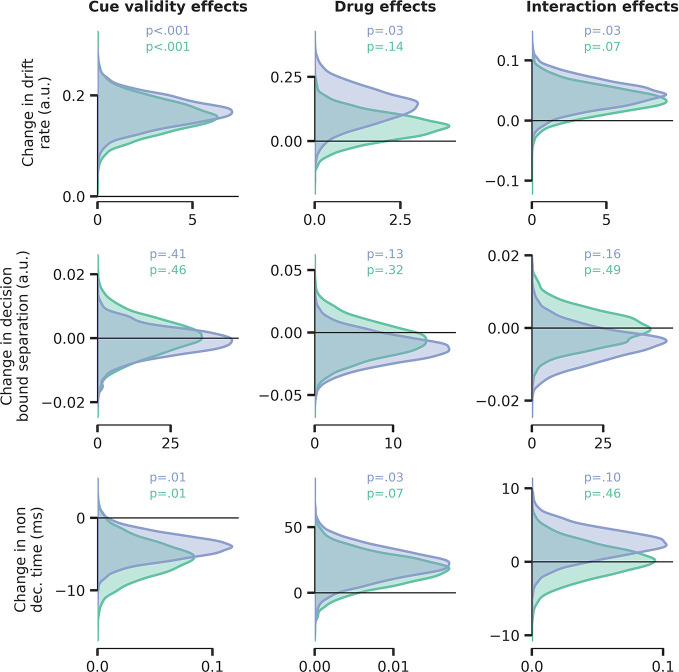
Figure 2—figure supplement 4. Parameter estimates of unweighted regression drift diffusion model (DDM).

Figure 2—figure supplement 4.

We verified whether applying weights to our effect coding scheme for the regression DDMs, used to counteract the disbalance in the proportion of validly and invalidly cued trials, affected our parameter estimates in any way by fitting the exact same models but now using regular, unweighted, effect coding for cue validity (–1 and 1).There were no substantial differences in parameter estimates compared to the model that used weighted effect coding. Blue distribution = atomoxetine (ATX) model, green distribution = donepezil (DNP) model.
Figure 2—figure supplement 4—source data 1. Source files for unweighted drift diffusion model (DDM) regression model parameter estimates.
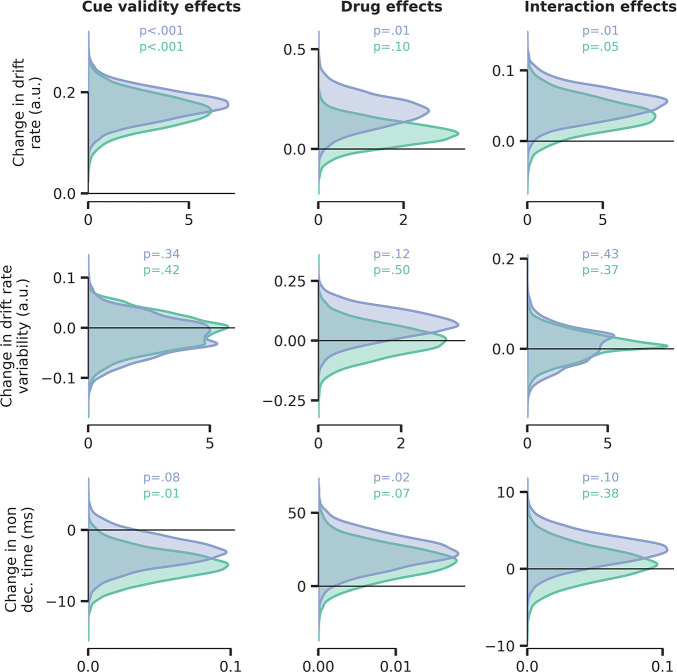
Figure 2—figure supplement 5. Drift rate variability was not modulated by drug or cue validity.

Figure 2—figure supplement 5.

This additional model allowed drift rate (top row), drift rate variability (middle row), and non-decision time (bottom row) to fluctuate with cue validity, drug condition, and their interaction, but decision bound separation was fixed across conditions. We observed no significant effects on drift rate variability. Blue distribution = atomoxetine (ATX) model, green distribution = donepezil (DNP) model.
Figure 2—figure supplement 5—source data 1. Source files for weighted drift diffusion model (DDM) regression drift rate variability model parameter estimate.