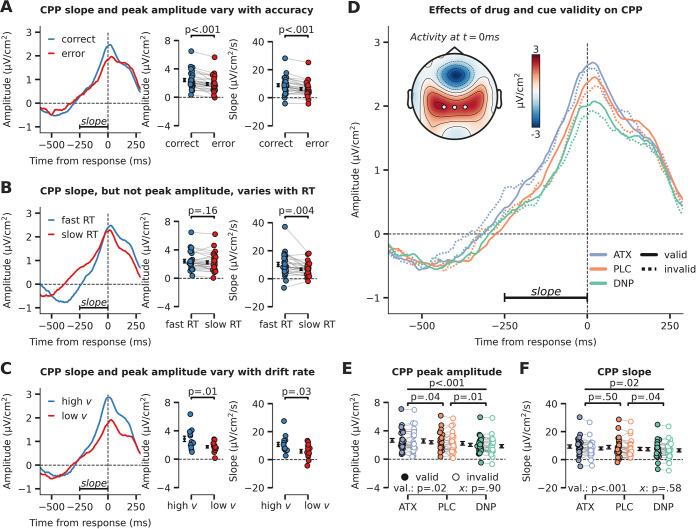
Figure 3. Evidence accumulation is affected by cue validity and drug, indexed by changes in centro-parietal positivity (CPP).
(A) Response-locked CPP for correct and incorrect answers, (B) for trials with fast and slow reaction times (RTs) and (C) for participants with overall high drift rate and low drift rate. (D) Modulation of response-locked CPP by drug and cue validity. The horizontal black line indicates the time-window for which CPP slope was calculated (linear regression from –250 ms to 0 ms pre-response). The topographic map shows activation at the moment of the response, with white markers indicating the centro-parietal ROI used for the CPP analyses (channels CP1, CP2, CPz). (E) Peak CPP amplitude, separately for drug and cue validity. (F) CPP slope for all drug and cue validity conditions. Note that x demarks the p-value for the omnibus interaction effect between drug condition and cue validity and that val. (short for validity) refers to the factor cue validity. Error bars indicate SEM.
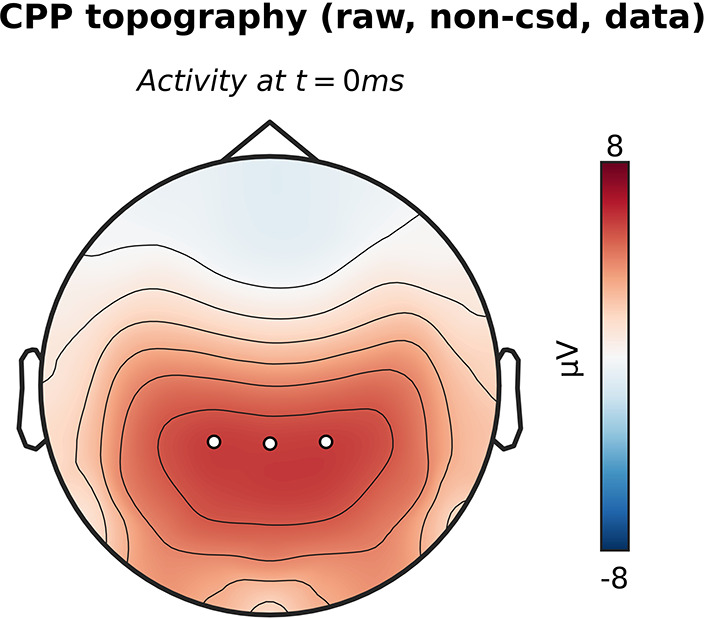
Figure 3—figure supplement 1. Centro-parietal positivity (CPP) topography without current source density (CSD) transformation.


