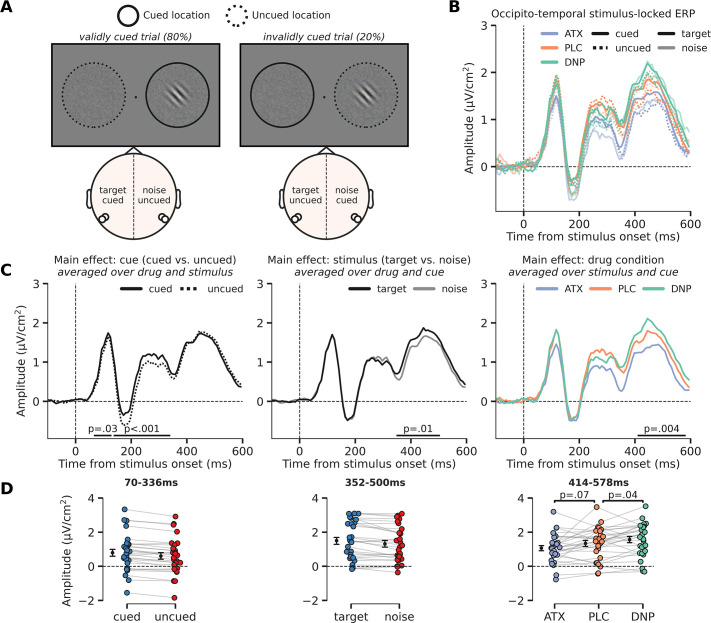
Figure 4. Modulation of perceptual processing by drug and attention, indexed by changes in occipito-temporal activity.
(A) Schematic of the definition of ERP conditions, based on the cued location and the location of the target stimulus. The cue was presented before the stimulus and is not shown here, but the cued and uncued location are, respectively, illustrated by solid and dashed circles around the stimulus (not shown in the actual experiment). We extracted activity from bilateral occipito-temporal regions of interest (ROIs) (left ROI: P7/P9 and right ROI: P8/P10; see white markers in topographic map), separate for target stimuli (ROI contralateral to target) and noise stimuli (ROI ipsilateral to the target) and cued stimuli (ROI contralateral to cued location) and uncued stimuli (ROI ipsilateral to cued location). This was done for each drug condition. In the schematic we show two example scenarios for when the target stimulus appeared on the right side of fixation (it could also appear on the left side of fixation). In the first example, in the left panel, the target stimulus was cued (validly cued trial), in which case the left ROI shows activity related to the ‘cued target’ and the right ROI shows activity related to the ‘uncued noise’ stimulus. In the second example, in the right panel, the noise stimulus was cued (invalidly cued trial) in which case the right ROI shows activity related to the ‘cued noise’ stimulus and the left ROI shows activity related to the ‘uncued target’ stimulus. By defining ERP traces as such, we were able to investigate the effects of the spatial cue in isolation (i.e. cued vs. uncued, spatial attention effect) and in interaction with stimulus identity (i.e. cue validity effect). (B) Stimulus-locked ERPs (0 ms = stimulus presentation) over regions processing the target stimulus (i.e. contralateral to target stimulus, opaque line) and the noise stimulus (i.e. ipsilateral to target stimulus and/or contralateral to noise stimulus, transparent line). These traces are further split up depending on cue condition, meaning whether the stimulus was cued (i.e. contralateral to the cue, continuous line) or uncued (i.e. ipsilateral to the cue, dashed line). Note that the traces of validly cued trials can be seen in both cued target (solid, opaque lines) and uncued noise trials (dashed, transparent lines). Finally, the traces are plotted for the different drug conditions. (C) The main effects of cue (cued vs uncued, left panel), stimulus identity (target vs. noise, middle panel), and drug condition (ATC/donepezil [DNP]/placebo [PLC], right panel). (D) Data extracted from these cluster for each of the conditions of the main effect. Post hoc two-sided t-test were performed to test the respective effects of atomoxetine (ATX) and DNP vs. PLC (right panel). Error bars indicate SEM.


