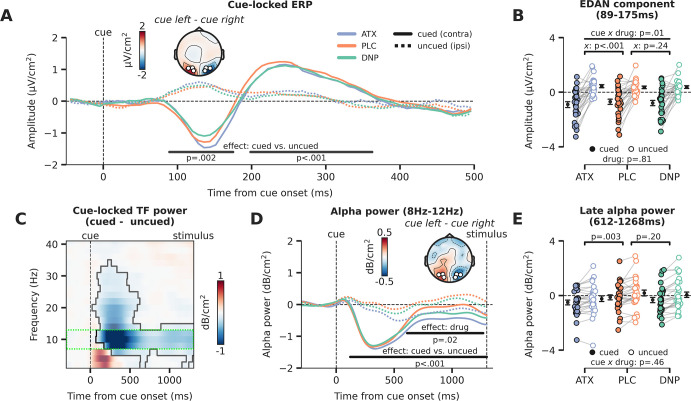
Figure 5. Attentional and catecholaminergic modulation of prestimulus cortical activity.
(A) Cue-locked ERP (µV/cm2) over occipital regions reflecting the cued location (hemisphere contralateral to the cued direction) and reflecting the uncued location (hemisphere ipsilateral to the cued direction), split up for the three drug conditions. Black horizontal bars show repeated measures ANOVA (rmANOVA) main effects of cue, cued (contra) vs. uncued (ipsi), cluster corrected for multiple comparisons. The topographic map shows the contrast between a cue to the left vs. a cue to the right (time-window: 89–175 ms, early cluster in which we observed the lateralization effect). White markers indicate the regions of interest (ROIs) used for all cue-locked analyses. (B) Average activity within the early temporal cluster for the hemisphere associated with the cued (contra) vs uncued (ipsi) location as a factor of drug, showing lateralized effects. The p-value of the interaction effect between cue and drug (pairwise vs. placebo [PLC]) is demarked with x. (C) The difference in time-frequency (TF) power (dB/cm2) for cued (contra) vs uncued (ipsi) locations (lateralization effect). The significant TF cluster (highlighted by the solid black line) is derived from cluster-based permutation testing controlling for multiple comparisons. The green dotted box indicates the alpha-band TF ROI that is used to compute panel D. (D) Cue-locked prestimulus alpha power (dB/cm2) over occipital regions associated with the cued (contra) and uncued (ipsi) location, split up for the three drug conditions. Black horizontal bars show rmANOVA main effects for cue (contra vs. ipsi, lateralization effect) and drug. The topographic map shows the contrast between when a cue to the left vs. a cue to the right was presented (time-window: 659–1253 ms, cluster in which we observed a main effect of drug). (E) Average alpha power within the late temporal cluster in which drug effects on alpha power were observed, split up for cue and drug conditions. The p-values on top reflect the main effects between atomoxetine (ATX)/donepezil (DNP) and placebo (PLC) and the p-value at the bottom demarked with x depicts the omnibus interaction effect between drug condition and cue. Error bars indicate SEM.


